Summary – A top-down review of interesting calls and comments made last week in Treasuries, monetary policy, economics, stocks, bonds & commodities. TAC is our acronym for Tweets, Articles, & Clips – our basic inputs for this article.
Editor’s Note: In this series of articles, we include important or interesting Tweets, Articles, Video Clips with our comments. This is an article that expresses our personal opinions about comments made on Television, Tweeter, and in Print. It is NOT intended to provide any investment advice of any type whatsoever. No one should base any investing decisions or conclusions based on anything written in or inferred from this article. Macro Viewpoints & its affiliates expressly disclaim all liability in respect to actions taken based on any or all of the information in this article. Investing is a serious matter and all investment decisions should only be taken after a detailed discussion with your investment advisor and should be subject to your objectives, suitability requirements and risk tolerance.
1.What moves the US Stock Market?
The answer is Dr. Kudlow & his reassurances about being so close to the “deal” with China. We all know it but a picture is worth so many words.
- Ryan Detrick, CMT@RyanDetrick – I don’t know, maybe trade does move markets?
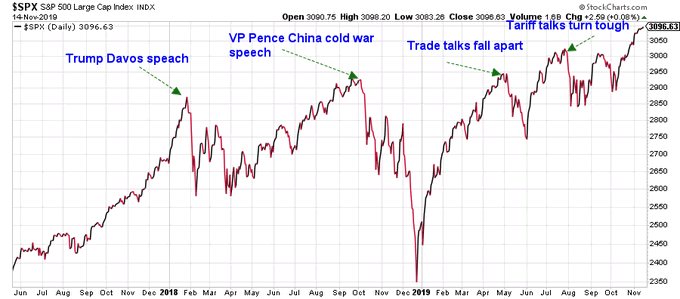
That may be why Jim Cramer warned in the first segment of his Mad Money show on Friday that if we don’t get some news about a trade deal over the weekend, the US stock market might give back some gains on Monday.
Even some believers in the 2013-redux are worrying about dizzying heights.
- Market Ear – S&P – will it gain another 5% before 2020? – “Our” 2013 pattern continues trading perfectly…but the air is getting thinner up here.
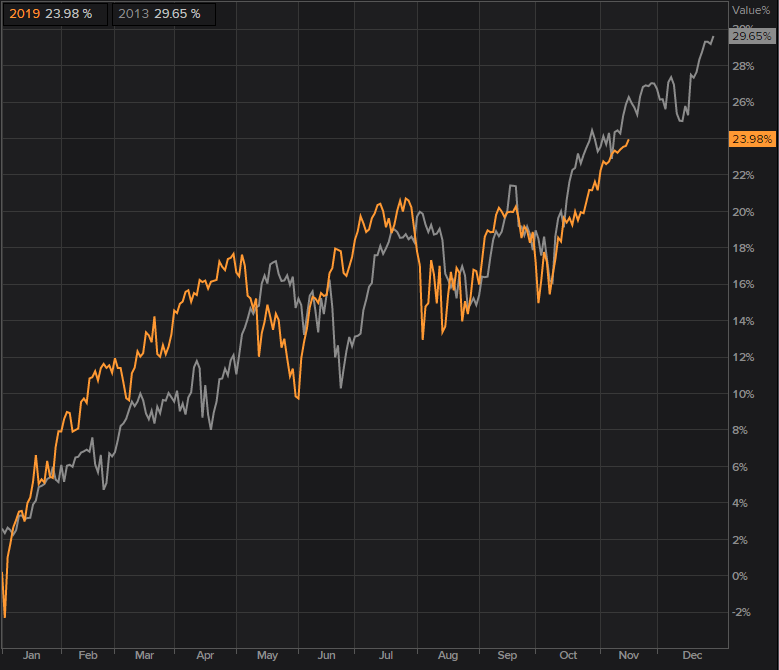
Even in 2013, early December provided a nice buying opportunity. So it would be par for the course to get a pullback anytime. But what might we see later this quarter? Based on one historical precedent, a 5% higher target might only be for the faint of heart.
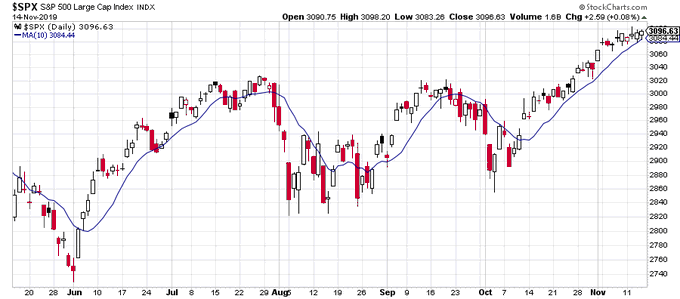
- Ryan Detrick, CMT@RyanDetrick – All good things come to an end. The S&P 500 touched it’s 10-day MA today. It went an amazing 24 days in a row above it. This was the longest such streak since 25 days ended on 3/5/98. What happened next? Up 8.5% a month later.
Our own view of year-end rally has been shaped by what we heard from Abby Joseph Cohen in October 2000 – that an year-end rally is a given unless there is deflation on the horizon. So despite all the negatives we see & hear (some featured below), we still think that a rally to close out the year is a safer bet. After all, will the good doctor Kudlow play the grinch & tell us no deal is more likely than a deal? We don’t think so.
2. The Economy
Once again, Chairman Powell took a victory lap & put up another “Mission Accomplished” this past week. His own regionals seem to disagree.
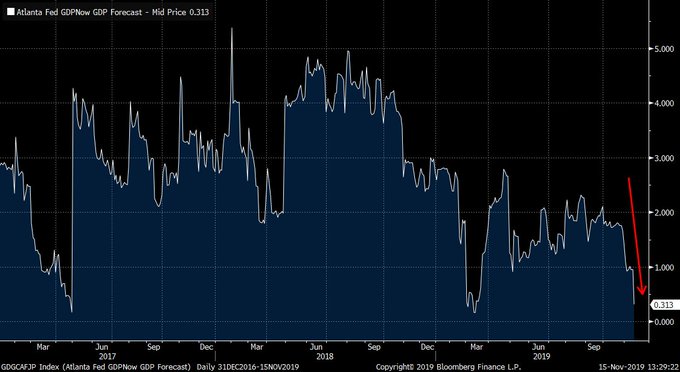
- Richard Bernstein@RBAdvisors – Atlanta #Fed“GDP Now” real time forecasting tool saying there’s virtually no #GDP now (well, GDP growth).
But wasn’t the AtlantaFed methodology deemed unreliable especially when contrasted to other regionals, especially the NY Fed?
- Liz Ann Sonders@LizAnnSonders – Both@AtlantaFed GDPNow & @NewYorkFed Nowcast down to almost no growth expected for Q4
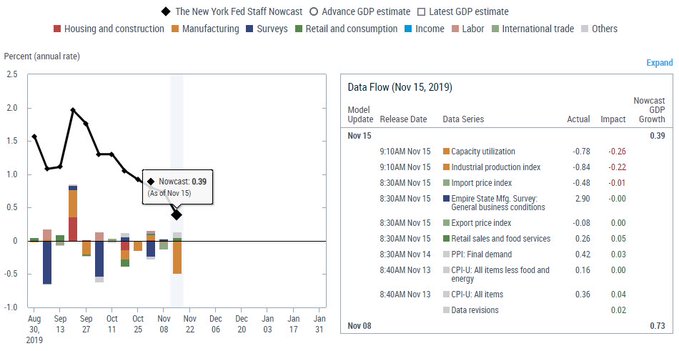
That is not good news for the “Mission Accomplished” banner of the Powell Fed. But what might actually be worse news?
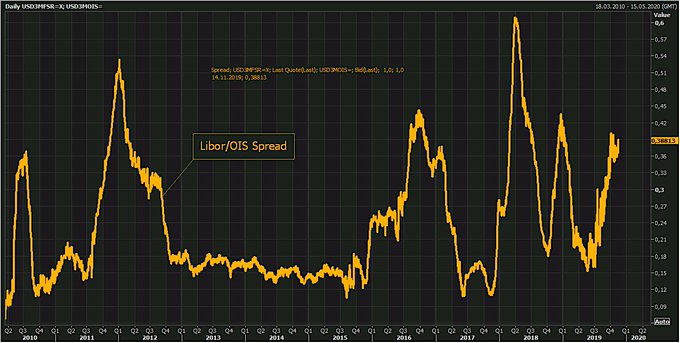
- Holger Zschaepitz@Schuldensuehner – Something seems to be wrong in the banking sector. This is evident not only in the US Repo market but also in the US Libor-OIS spread, which continues to rise.
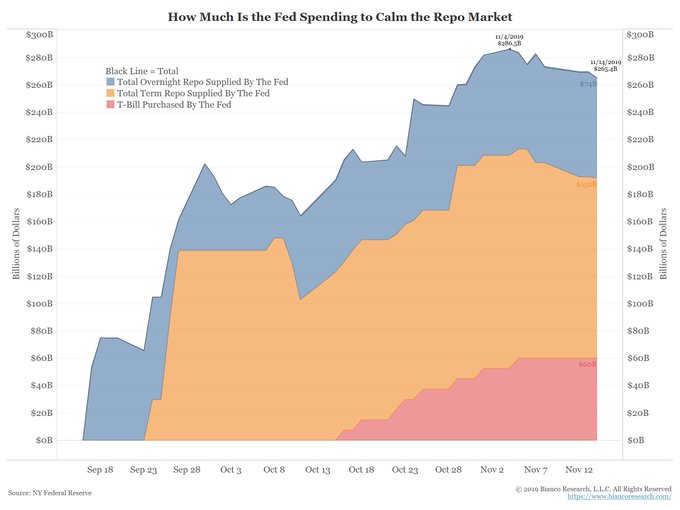
So the US Repo market is not healthy despite the large injections of liquidity by the Powell Fed? And that too when we have December staring at us, year-end being the peak of Repo illiquidity? So why didn’t we hear anything about the Repo market from Chairman Powell?
- Jim Bianco@biancoresearch – Because they know this repo problem is “on them” … about their credibility. The more they say “not QE”, “nothing to see here”, and “under control”, the more the expose their inability to understand this market. And next month is the beginning of year-end illiquidity.
Could they have actually have the opposite problem now?
- Jim Bianco@biancoresearch – Repo’s new problem … too many reserves. FF rate is now only 5 bps from breaking below the bottom of the 1.50% – 1.75% target range. Powell said repo market is “under control” … drugged into submission. But now, too many downers (reserves). @GeorgeSelgin @DiMartinoBooth
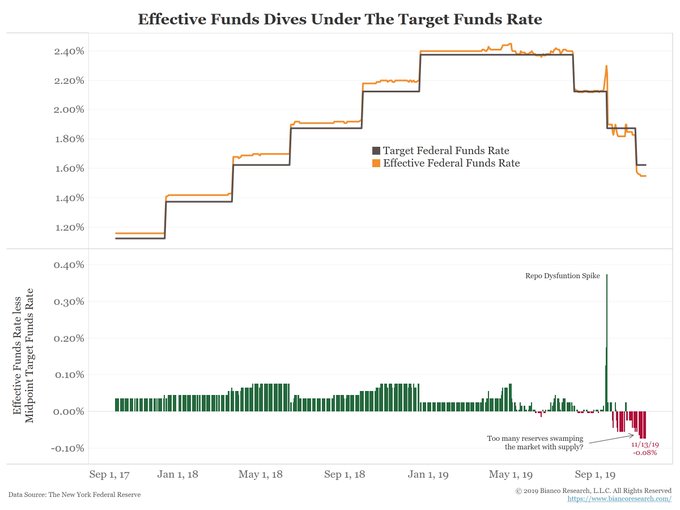
So how do they solve this problem of the effective Federal Funds rate falling below their recently reduced level? Will they lower rates in their December FOMC meeting on a tactical basis? Hard to do given their Mission Accomplished & “appropriate place” self-congratulatory pronouncements, right? Or do they move to longer term repos as they partly did this week? Or do they actually drain reserves? We can’t believe they will drain reserves into year-end. That could become not merely your average grinch but a Darth Vader grinch for the stock market rally.
So how can they address the rising US Libor-OIS spread, depicted in the Holger tweet above? If you look carefully at the 2012 column of the Holger graph above, you get one answer – transform current “Not QE” into a full-blown QE as was done in 2012-2013.
That would address the gripes of some Debbie Downers and make the Fed consistent with market behavior:
- AndreasStenoLarsen@AndreasSteno – I perfectly understand why asset prices increase due to the Fed soft QE4, but isnt it getting slightly out of hand? Markets are partying like this is a 2012 style QE-program but its not.. ndea.mk/Slowdown2
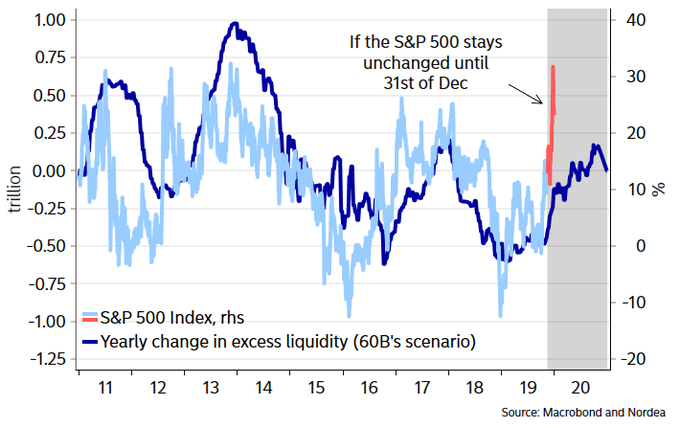
In short, cure the above chart’s deficiency by extending QE to the entire curve from today’s overnight or very short term Not QE. If they do it semi-quietly & expressly for year-end liquidity reasons, nobody would notice much, hopefully.
3. Interest Rates
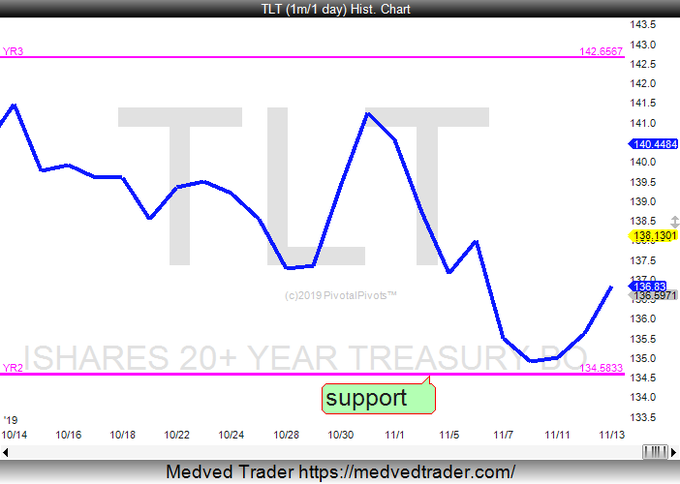
Kudos to Carter Worth of CNBC Options Action who, last week, had boldly suggested buying Treasury bonds & fading the month-long rise in Treasury rates. TLT was up 2.1% this week & yields along the entire Treasury curve fell on the week:
- 30-yr yld was down 11 bps; 10-yr yield was down 1-.5 bps; 7-year down 10 bps; 5-yr down 9 bps; 3-year down 8 bps & 2-yr down 6 bps in a bull-flattening move.
But frankly, this fall was led by a fall in German Bund yields which also fell in a bull-flattening move. The German 30-year yield fell by 9 bps to 15 bps while the German 10-yr & 2-yr rates fell by 7 bps to minus 33 bps & 2 bps to minus 63 bps resp.
Is this a one-week phenomenon as many say or was this a reversal from yearly pivot points?
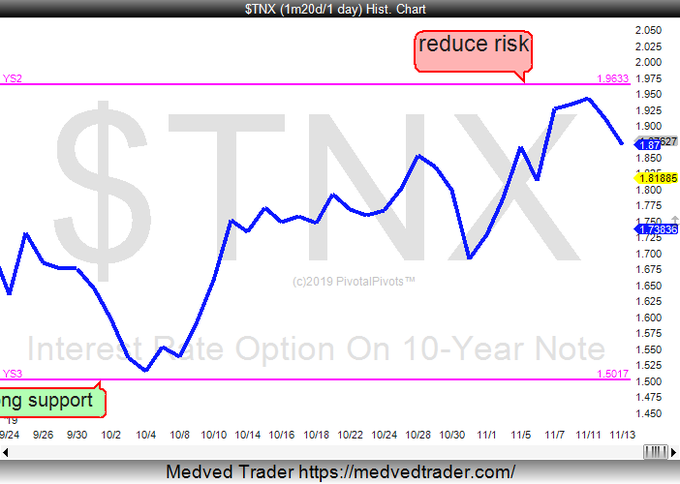
- Jeff York, PPT@Pivotal_Pivots – – $TNXis at resistance and $TLTat support. The BIGGEST reversals happen at the Yearly pivot points. #TradethePivots @PivotalPivots
Some saw this as an omen for the stock market next week.
- Igor Schatz@Copernicus2013 – The bond move underscores the fact that tactically equities are on borrowed time into opex and we are likely to see a sustained pullback in $ES next week
But is the bond market the main signal or will a more correlated signal prove necessary for a sharp pullback in the equity market?
4. VIXPLOSION?
How low is the VIX?
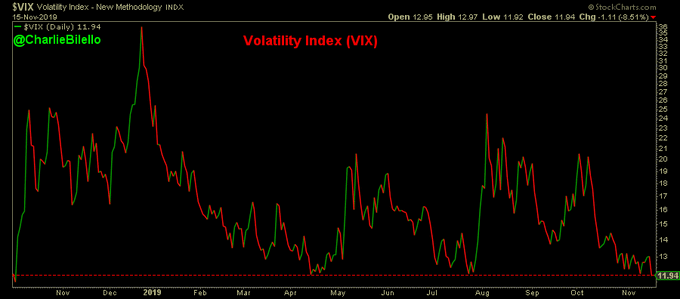
- Charlie Bilello@charliebilello – – Volatility Index: lowest close since October 3, 2018. 11.94. $VIX
Is it just the spot level or is a spread giving more information?
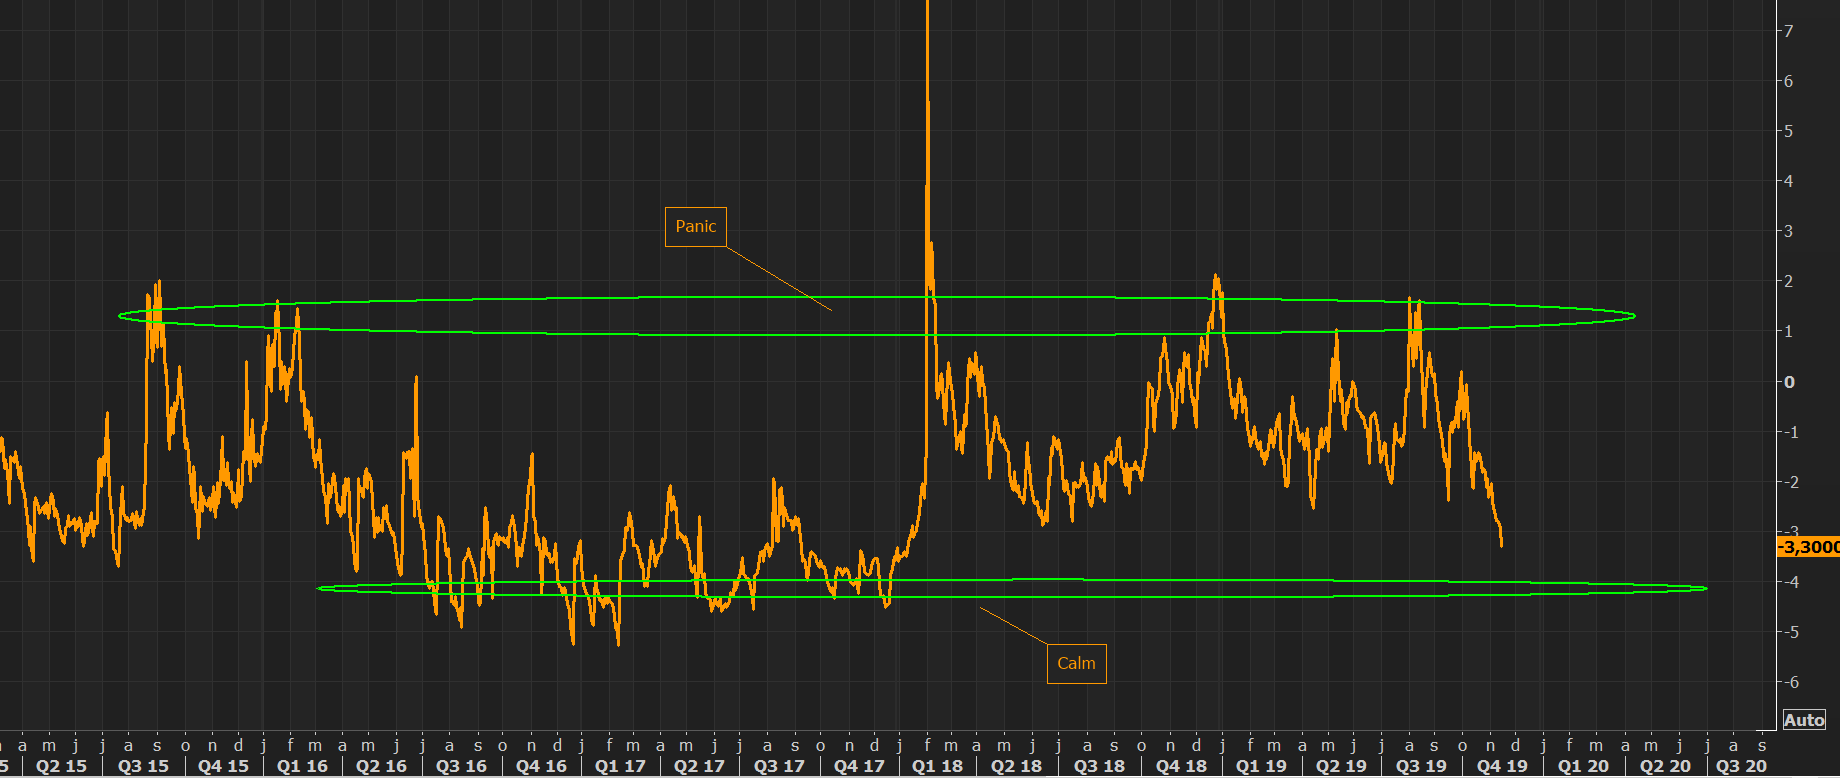
- Market Ear – Volatility – so calm, so calm, but have no fear? VIX futures spread (below the 2 vs 8 months) continues imploding. The spread is approaching levels we have not seen in a very long time. We have gone from panic to calm pricing of risk in a few months only. People are once again lulled into strategies of picking up dimes in front of the steamroller as the short end of the curve is massively “hated”. Stuff is not moving much, but gamma is becoming very inexpensive here.
Another view of why a Volatility Event may be on the horizon.
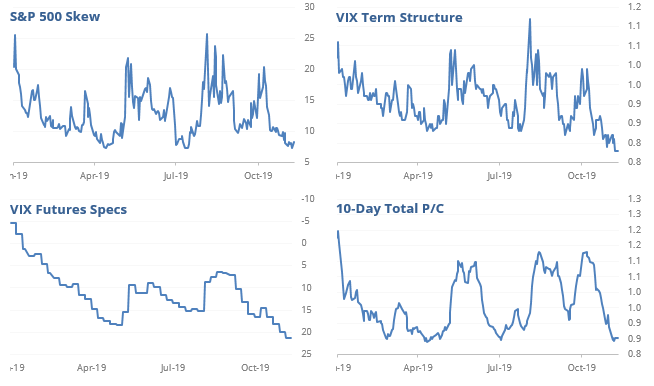
- SentimenTrader@sentimentrader – 4 Reasons Why A Volatility Event Is On The Horizon
And then you have Carter Worth of CNBC Options Action suggesting the possibility of a VIXPLOSION, or an explosion in the $VIX.
.
And one measure of stock volatility has already jumped higher.
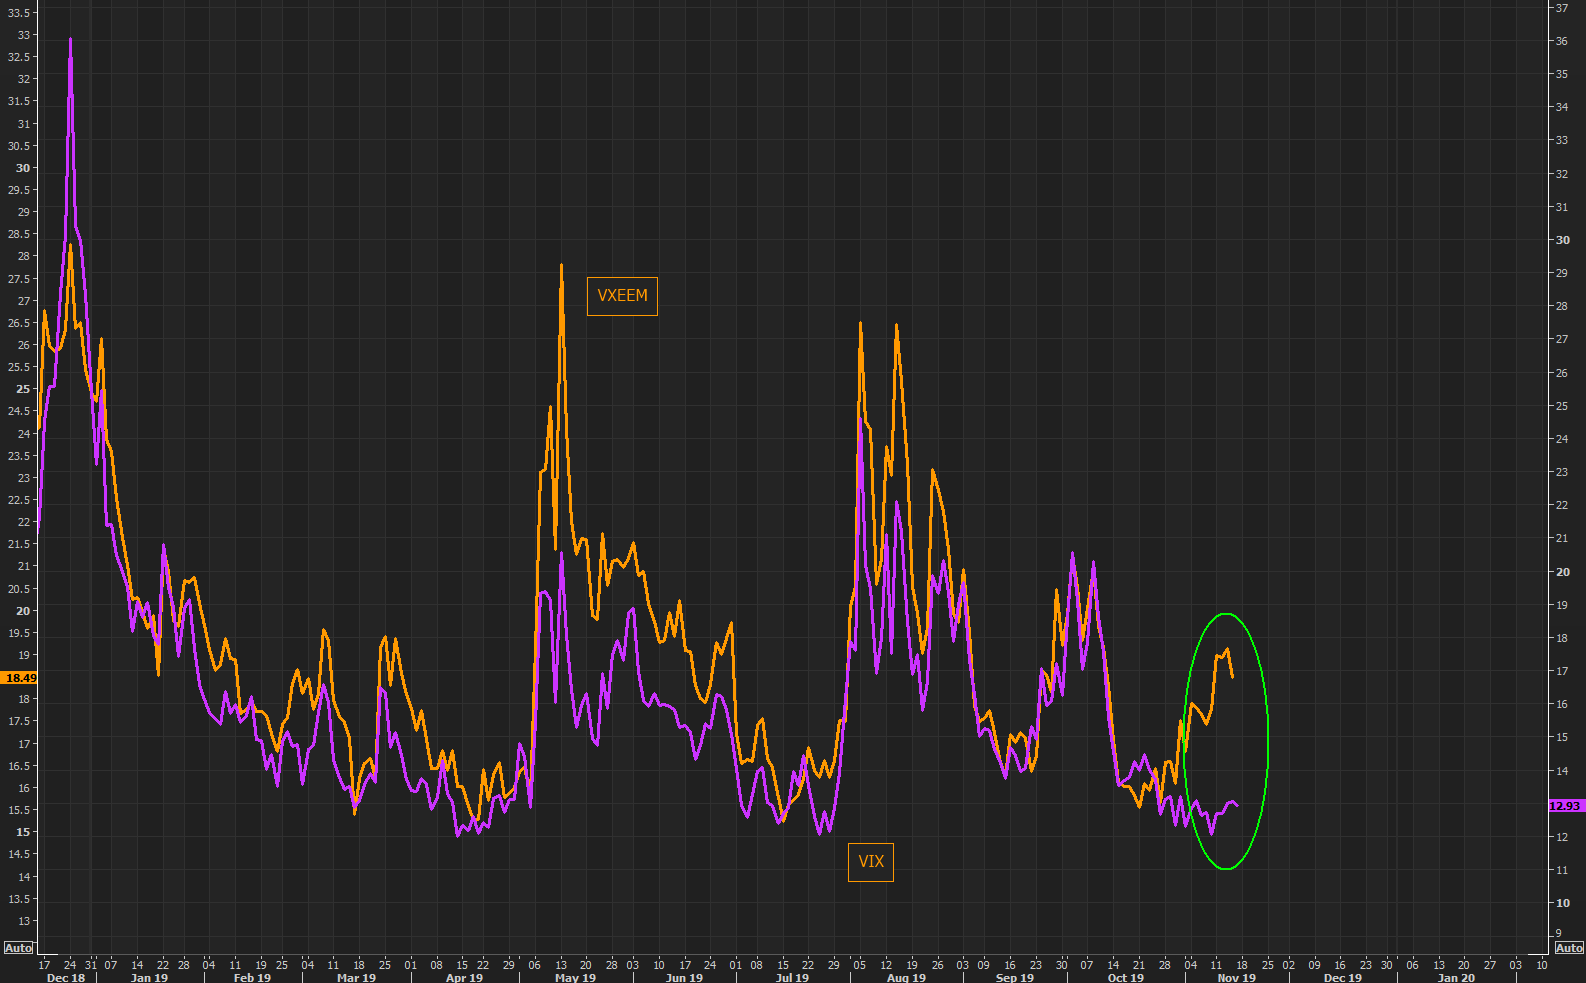
- Market Ear – What is Emerging markets nervous about (at least on a relative basis)? EM volatility, VXEEM, versus VIX gap getting rather wide here.
By the way, despite new all-time highs in US Indices major EM markets fell this week both in absolute terms & relative to the S&P 500.
5. Stocks
A change in tone but not in conclusion from Lawrence McMillan of Option Strategist:
- In summary, the $SPX and $VIX charts are bullish, while other indicators are on or near sell signals, and/or are in very overbought states. That’s not as bullish as things were a week or more ago, but it’s still bullish.
Conversely a DeMarkian view:
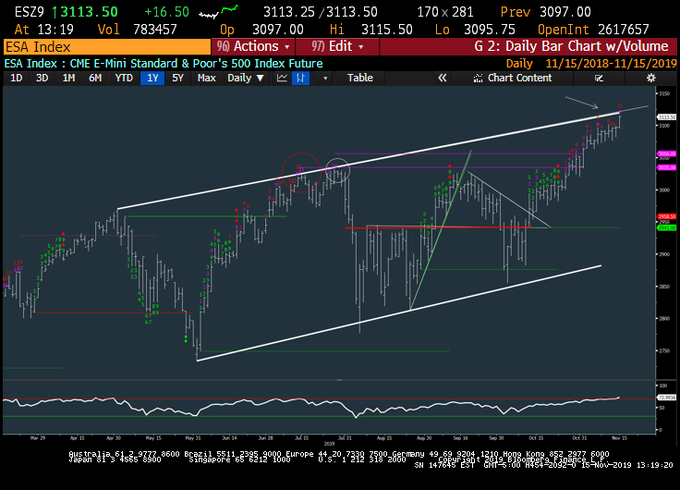
- Mark Newton@MarkNewtonCMT – S&P-Some might choose to ignore this structure, but it should be important into next week just as Counter-trend exhaustion sets in while time-wise this rally from early October is now equal in calendar days to the June-July bounce–$SPX $ES_F
After all the above, don’t you want a positive opinion? J.C.Parets provided one this week:
- “Today I want to call your attention to an interesting divergence that has come at important turning points in the past. Specifically I’m referring to the Wisdom Tree Hedged Exchange Traded Funds for Europe and Japan: $HEDJ and $DXJ respectively. These funds are priced in local currencies as opposed to most other ETFs around the world that are priced in US Dollars.”
- “First, here is the Europe Index Fund priced in Euro breaking out to all-time highs. I’ve been chuckling to myself a lot lately because when was the last time you could say the words “Europe” and “all-time” highs in the same sentence with a straight face?”
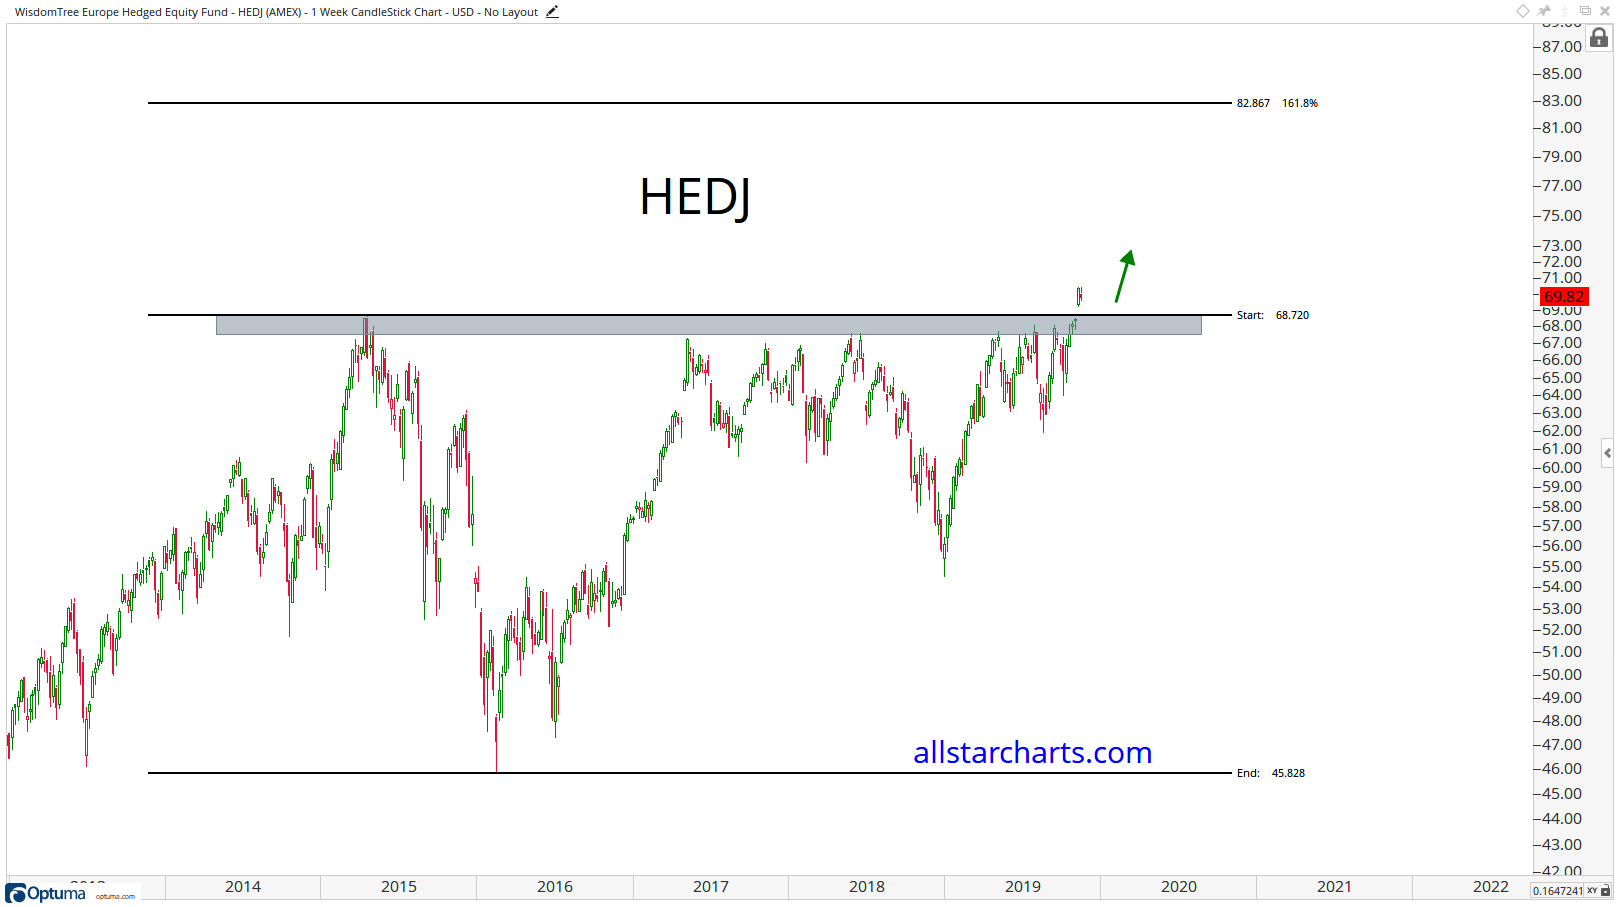
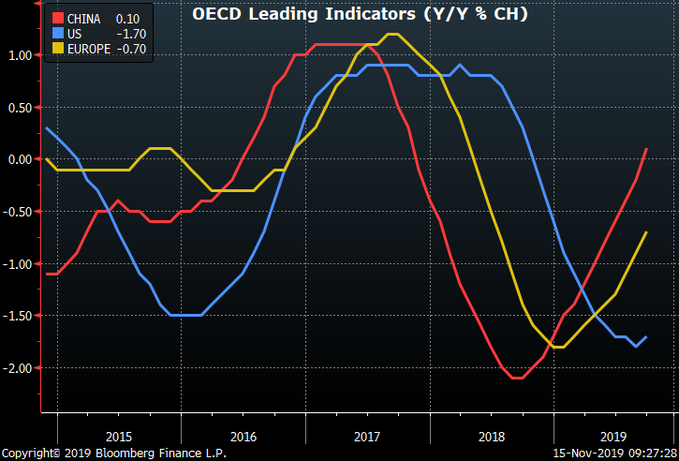
Parets wrote he would remain long as long as HEDJ was higher than $69. Interestingly, this is consistent with leading indicators rising in Europe:
- Richard Bernstein@RBAdvisors – Consensus is #US is best place to invest. Yet Leading Indicators for #China and #Europe showing considerably more strength than US.
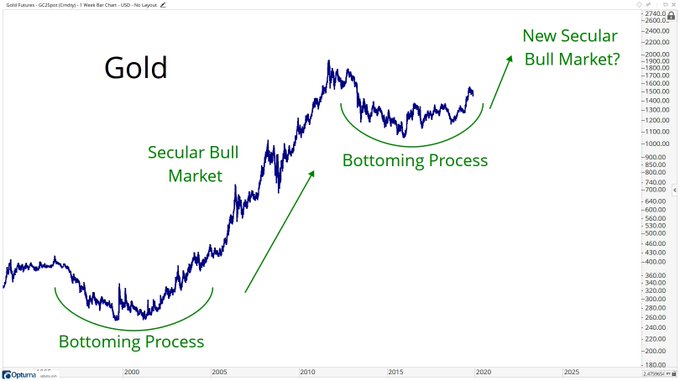
6. Gold
- J.C. Parets@allstarcharts – something like this?
Send your feedback to editor@macroviewpoints.com Or @MacroViewpoints on Twitter