Summary – A top-down review of interesting calls and comments made last week in Treasuries, monetary policy, economics, stocks, bonds & commodities. TAC is our acronym for Tweets, Articles, & Clips – our basic inputs for this article.
Editor’s Note: In this series of articles, we include important or interesting Tweets, Articles, Video Clips with our comments. This is an article that expresses our personal opinions about comments made on Television, Tweeter, and in Print. It is NOT intended to provide any investment advice of any type whatsoever. No one should base any investing decisions or conclusions based on anything written in or inferred from this article. Macro Viewpoints & its affiliates expressly disclaim all liability in respect to actions taken based on any or all of the information in this article. Investing is a serious matter and all investment decisions should only be taken after a detailed discussion with your investment advisor and should be subject to your objectives, suitability requirements and risk tolerance.
1.”huge secret sauce” & “he is doing it exactly right“
Remember the old dictum – don’t let a crisis go to waste. Ex-DoD chief Rumsfeld may have screwed that up but Fed Chairman Powell has done it just right. We go back to what we wrote after the end of October Fed meeting:
- “Who needs words when you have actual deeds like this? How long can the Fed keep adding liquidity? Theoretically as long as they want but practically at least until year-end. Remember what gave the Fed the reason to add “Not QE” QE? The Repo crisis. And when is the peak of Repo illiquidity? Year-end. So we expect the Fed to keep adding liquidity at least until year-end. “
What “actual deeds” you ask?
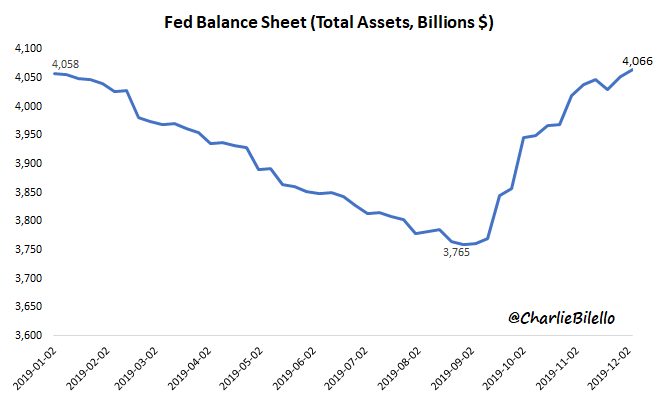
- Charlie Bilello@charliebilello – – Fed balance sheet moves up to $4.07 trillion, highest level of the year, up $306 billion over the last 3 months. “In no sense is this QE. This is nothing like it.” – Jerome Powell, Oct 8, 2019
Actually the above understates the liquidity being pumped into markets. Look what Rick Rieder of BlackRock said to BTV’s Jonathan Ferro on Friday morning after the Non-Farm payroll number:
- “there is a huge secret sauce – when you put $60 billion a month into markets; when ECB is putting 22 billion dollars into the markets; when corporations are buying back $5 billion per day, about $50 billion a month; that is immense liquidity“
It’s not just the amount, pointed Rieder:
- “he is doing it in the front-end of the curve; that’s really a big deal; he is doing it exactly right“
Some might say this is going into the markets and not into the economy. They are forgetting what Chairman Greenspan said a few months ago that economy & markets are now far more dependent on each other. Remember, just like a car, the US economy runs great when the transmission mechanism of the Fed is working together with the engine of the Administration. Since the Repo crisis & more explicitly since the October Fed meeting, the Powell Fed is working together with the Trump Administration. We are now seeing the results.
To non-believers we ask, don’t credit strength & strength in economy go hand in hand, especially under high liquidity conditions? Remember the panicky shoot up in CCC-debt yields two weeks ago. That was supposed to be a canary in the credit market’s coal mine. But after Friday’s strong 266,000 jobs number, a credit manager said on Bloomberg Real Yield that now the shoot up in CCC yields could be viewed as a buying opportunity.
This, as Rick Rieder said on Friday, is the huge difference between the US economy & the moribund European economy. He was almost poetic in pointing out that Europe doesn’t have ” … the fast rivers of cash flow that are driving the US economy … “.
Remember the big decline in stocks on Tuesday morning after President Trump said he would be fine without a deal with China? Now remember how the stock market closed with a buy program that afternoon. So the S&P had a fast nasty fall that was reversed just as quickly by Friday.
- Mark Newton@MarkNewtonCMT – The near-2 month lift from Oct 2 to Nov 27 gained over 9% and 25% of this was erased in 3 days, turning Daily momentum gauges Negative & sending RSI to lowest in nearly 2 months, yet has been recouped in equally as quick of a fashion, & no damage to weekly charts to trend or Mo
That folks, is how you spell immense liquidity. What about non-believers you ask?
- Market Ear –Still a non believer? – 2013 perfection continues
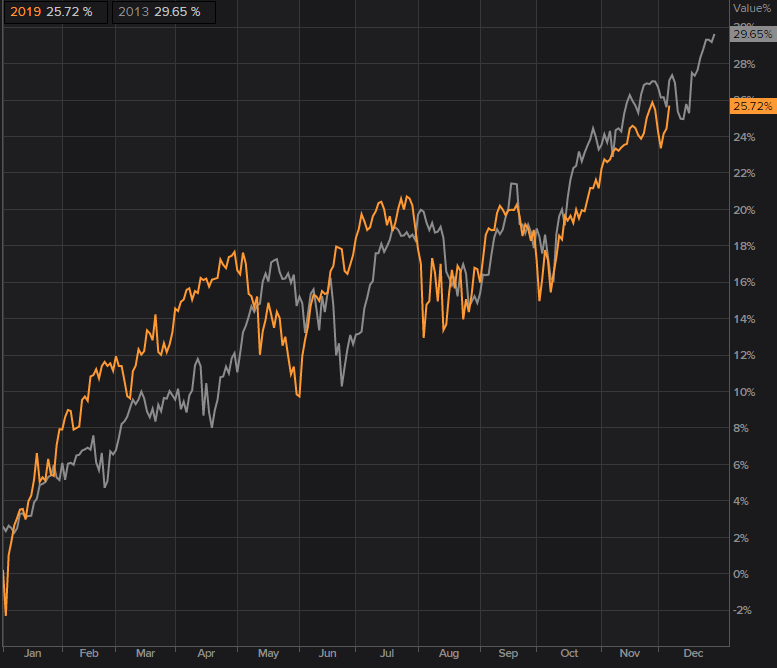
Believers should note however that the above 2013 chart suggests another nasty dip next week. That could come from the Fed on Wednesday, the ECB &/or the British election on Thursday or the Retail sales numbers on Friday. Then, of course, we could get a nasty fall on the following Monday from a negative news on tariffs.
Now if that nasty fall is just as easily made up by a bigger rally in the week after, then you can truly summon your inner Shelly and sing “Hail to thee blight spirit” to the river of liquidity that “from Fed-heaven or near it, pourest her full heart” for us investors.
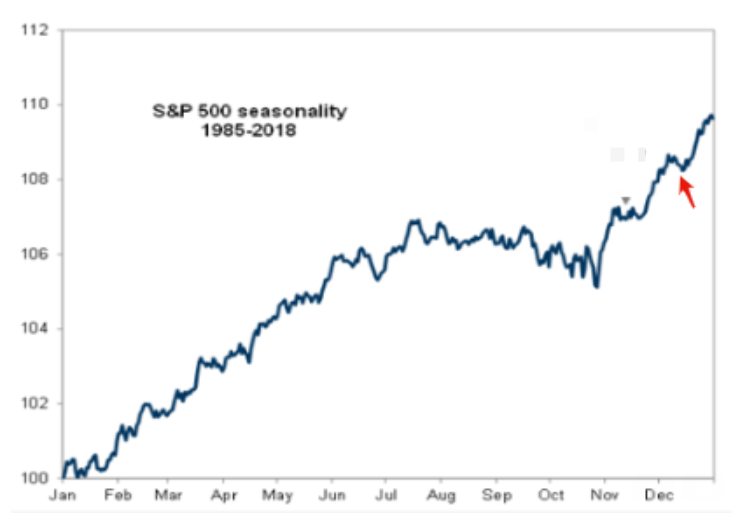
No, we have not gone nuts. We are simply trying to climb up to the Stephen Moore peak of describing the NFP number “a magical moment for the U.S.” on Friday evening on Fox. But you know what could make so many non-believers go nuts? If the message in the chart below gets realized by December 31:
- Market Ear – Remember the NASDAQ seasonality chart? We are at the red arrow.
2. Treasury Rates
What drives US interest rates?
- Lawrence McDonald@Convertbond – In 2019, who in their right mind thinks treasury bond yields have anything to do with US economic data? Has everything to do with the data implosions Germany (black zero), Japan, a colossal negative yield drag.
We all saw this again on Monday when Treasury rates shot up hard in sympathy with German Bund rates. That was mainly due to reports about demand by Merkel’s new coalition partners for increased fiscal spending by Germany. Remember that the fears about new ECB chief Lagarde forcing Germany to increase fiscal spending led to the big move up in German & US rates a couple of months ago. How big a move has it been? From minus 70 bps to minus 28 bps in German 10-year yield.
That reconfirms our belief that just as the S&P is subject to volatility from US-China deal news, the Treasury rates are subject to volatility from fears of German fiscal spending plans. No wonder BlackRock’s Rick Rieder prefers front-end of the Treasury curve as he told BTV’s Jonathan Ferro on Friday post-NFP:
- “… front-end of the yield curve is incredibly attractive today for a variety of reasons – Fed is going nowhere; Fed’s going to watch this [NFP] number & say great; Fed’s doing nothing … However if the economy slows, Fed is going to cut rates; 2-year note is pretty hard to sell at these levels because you have got reasonable carry & you have got asymmetric risk reward … “
Rieder said he finds the back-end (i.e. longer maturities) uninteresting except for the balance it provides to a portfolio. Priya Mishra of TD securities made a similar but stronger comment saying “… Treasuries are very cheap as a hedge for risk assets… “.
Our discussion above has been focused on the market’s reaction to the NFP report & not to some of the not so flattering signals some found in the details. One obvious question is why the huge difference between the terribly weak ADP report & the much stronger than expected NFP report. One answer is below:
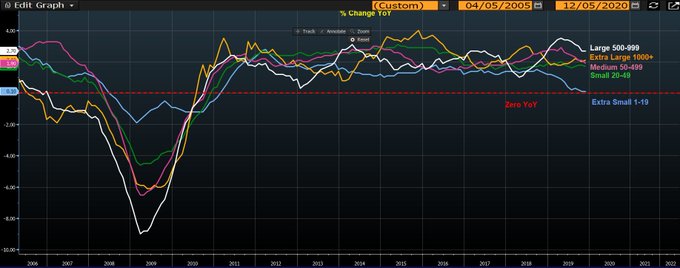
- Julian Brigden@JulianMI2 – There’s a 2 standard deviation divergence between ADP and NFP. One of the major drivers is the collapse in small business employment. That is something that the BLS has always struggled to capture but in the GFC was a leading signal. newyorkfed.org/medialibrary/m
3. Stocks
From Lawrence McMillan of Option Strategist on Friday:
- In addition to the above technicals, this is a seasonally bullish period for stocks. The Post-Thanksgiving “rally” is not exactly a robust one yet, but the Russell 2000 is beginning to outperform $SPX.
- In summary, the $SPX and $VIX charts remain positive and have seemingly clear demarcation levels. As long as $SPX remains above support, and $VIX remains subdued, the outlook for stocks is bullish.
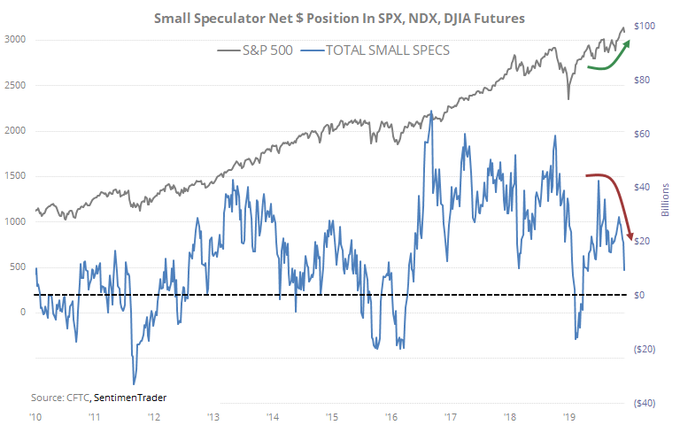
Is there a contrarian catalyst for an up move in stocks?
- SentimenTrader@sentimentrader – Small speculators in index futures are net long only about $9 billion worth of futures. That’s down from $60 billion last October.
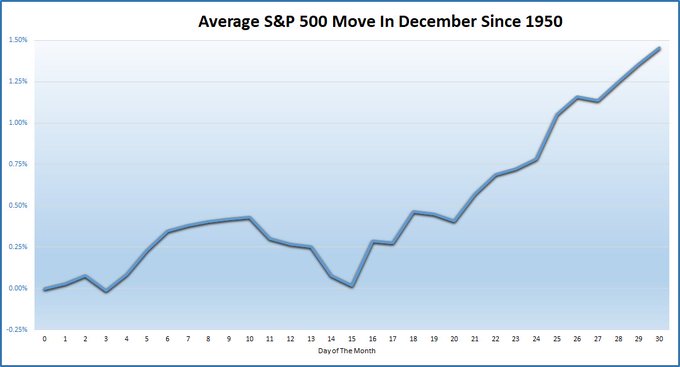
One reason we should not be discouraged by the first week of December:
- Ryan Detrick, CMT@RyanDetrick – – Here’s what your average December for the S&P 500 looks like. Nearly all the gains happen late in the month.
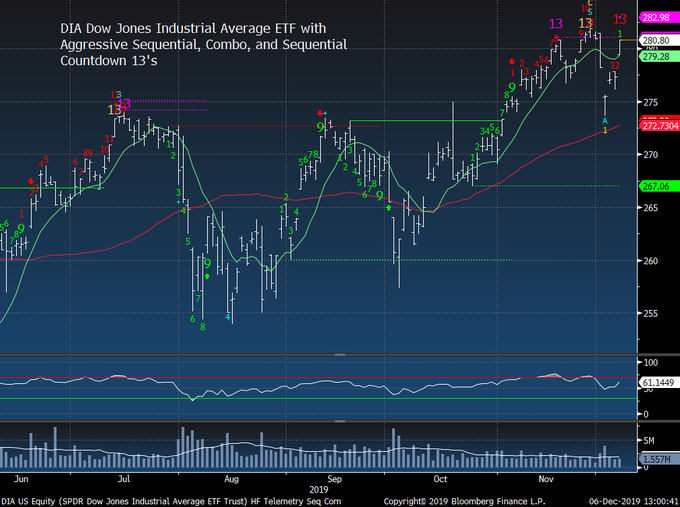
Now for the negatives. Last week Tom DeMark was disappointed about not getting to his full 13 count. This Friday’s rally solved that for a fellow DeMarkian:
- Thomas Thornton@TommyThornton – $DIA Dow Jones Industrial Average with DeMark Sequential Countdown 13 today. Expect lot’s of “Dow Points” lower
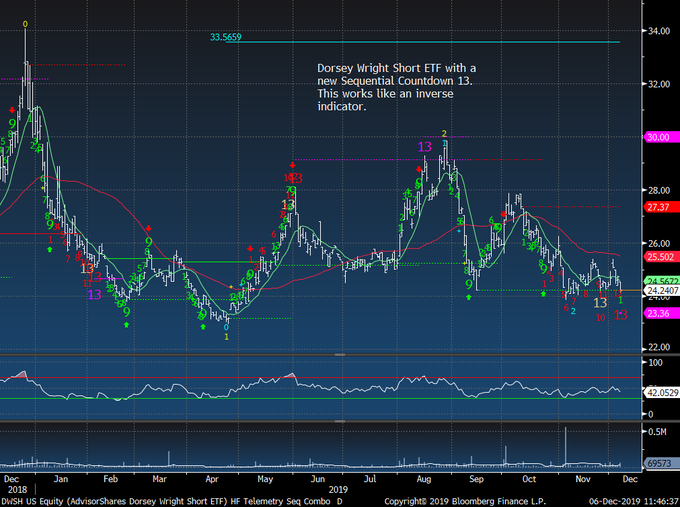
For those who want a short exposure:
- Thomas Thornton@TommyThornton – Dorsey Wright Short ETF with a DeMark buy Countdown 13. This correlates with the upside sell Countdown 13 in play with the $SPX, $NDX, $INDU $RYT Buy this is you want short exposure
Remember the phenomenal call by the famous Larry Williams to buy stocks just before labor day. This week Jim Cramer featured the call by Larry Williams about the tide turning. Mr. Williams thinks the Bears will have the run of the place into February 2020. So his call is sell the one more bounce he sees ( as of Monday, December 2) & stay out of the way in to February 2020. He think it will be ugly & that animal spirits will turn from bullish to bearish.
4. Contrarian calls
First the reality as of now:
- Market Ear – Over 24 months: basically only US equities up
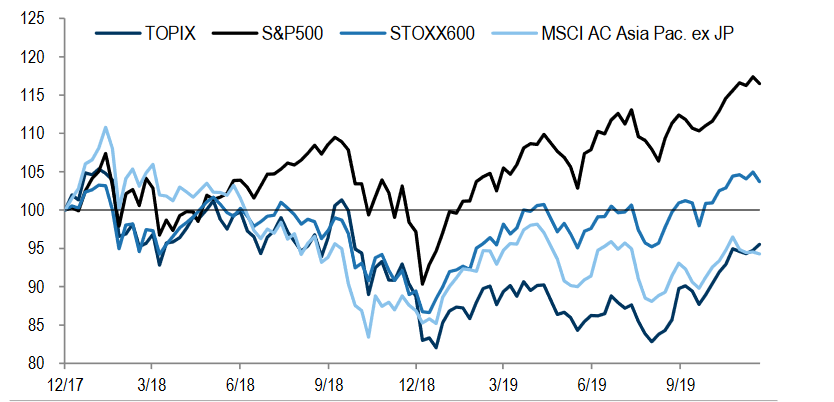
And we know why Europe has been so moribund to quote BlackRock’s Rick Rieder. So could some one actually say buy European stuff & that too the center of the swamp – Banks? But before that, what are CDS of European banks doing?
- Lawrence McDonald@Convertbond – EU Bank CDS outperforming US banks this month, meaningfully… Credit leads…
That brings us to:
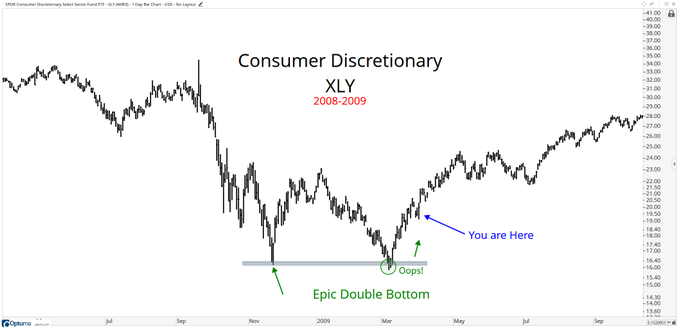
- J.C. Parets@allstarcharts – Dec 4 – the European Banks remind me a lot of the Consumer Discretionaries 10 years ago
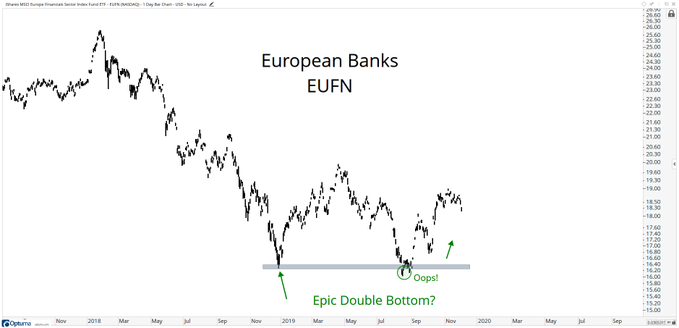
What similarity does Parets see with Consumer Discretionary stocks in 2009?
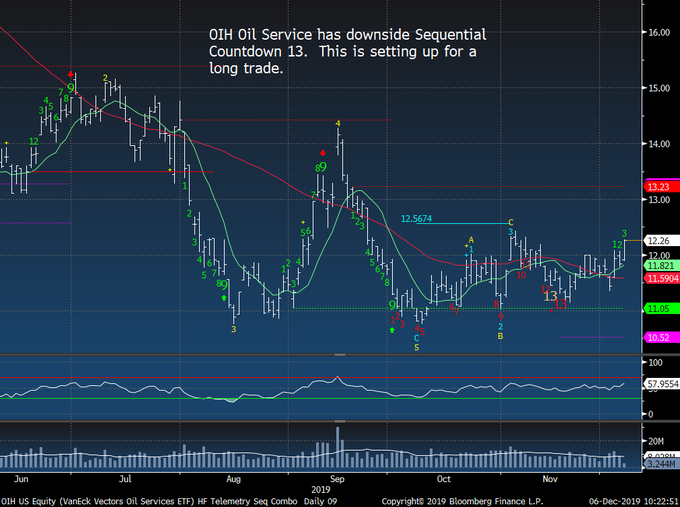
The second contrarian call comes from a DeMarkian:
- Thomas Thornton@TommyThornton – I’m long $OIH and really getting excited to see energy sector potential on the long side $XLE $XOP
Send your feedback to editor@macroviewpoints.com Or @MacroViewpoints on Twitter