Summary – A top-down review of interesting calls and comments made last week in Treasuries, monetary policy, economics, stocks, bonds & commodities. TAC is our acronym for Tweets, Articles, & Clips – our basic inputs for this article.
Editor’s Note: In this series of articles, we include important or interesting Tweets, Articles, Video Clips with our comments. This is an article that expresses our personal opinions about comments made on Television, Tweeter, and in Print. It is NOT intended to provide any investment advice of any type whatsoever. No one should base any investing decisions or conclusions based on anything written in or inferred from this article. Macro Viewpoints & its affiliates expressly disclaim all liability in respect to actions taken based on any or all of the information in this article. Investing is a serious matter and all investment decisions should only be taken after a detailed discussion with your investment advisor and should be subject to your objectives, suitability requirements and risk tolerance.
1.Forget what we say; Watch what we do?
What a glorious week it was! It began with Michigan dismantling the vaunted No. 8 Notre Dame in Ann Arbor, MI. That alone should raise consumer confidence in America. Then on Sunday President Trump told the nation about the terrific strike by US Special Forces on the compound of ISIS leader Al-Baghdadi & his death. And the week ended with new all-time highs in the US Stock market.
Between the bookends was an event on Wednesday afternoon that featured an American organization that not many know about. And what did they do?
The Fed cut rates on Wednesday as every one expected. And they told us two things:
- they will not raise rates unless strong evidence of an inflation upturn is seen, meaning forget about it,
- they will lower rates if material weakness emerges in the US economy
This is clearly quasi-bullish. As Rick Rieder of BlackRock said on BTV, the Fed is telling us that rates will either stay here or go lower. So he thinks the short end of the curve offers a very attractive risk reward.
On the other hand, the above is not really bullish as say a verbal commitment to act to keep the economy in an upturn. So why was this not deemed as hawkish or disappointing? Because the market chose correctly to see what the Fed is doing rather than saying:
- Holger Zschaepitz@Schuldensuehner – In case you missed it: #FedBalance Sheet jumped above $4tn this week as Fed has restart QE (which must not be named).
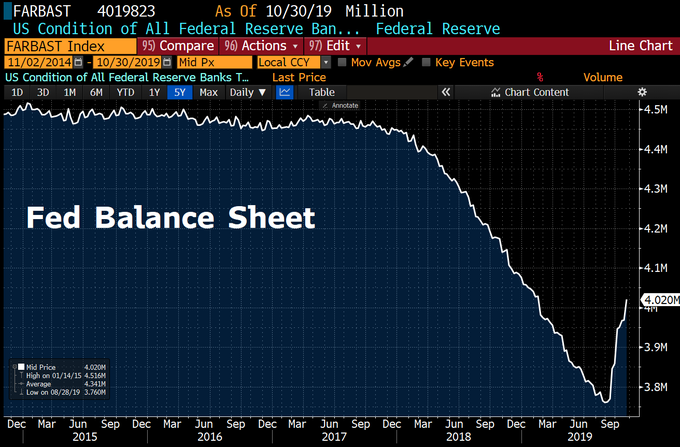
Who needs words when you have actual deeds like this? How long can the Fed keep adding liquidity? Theoretically as long as they want but practically at least until year-end. Remember what gave the Fed the reason to add “Not QE” QE? The Repo crisis. And when is the peak of Repo illiquidity? Year-end. So we expect the Fed to keep adding liquidity at least until year-end.
So if the economy looks as if it is turning down, the Fed can shout “material” and lower rates as well as add more “Not QE”. If the economy remains in its current trajectory, then earnings will not collapse & stocks can rise aided by Not QE. Kinda reminds of the Tepper corollary in 2013, doesn’t it?
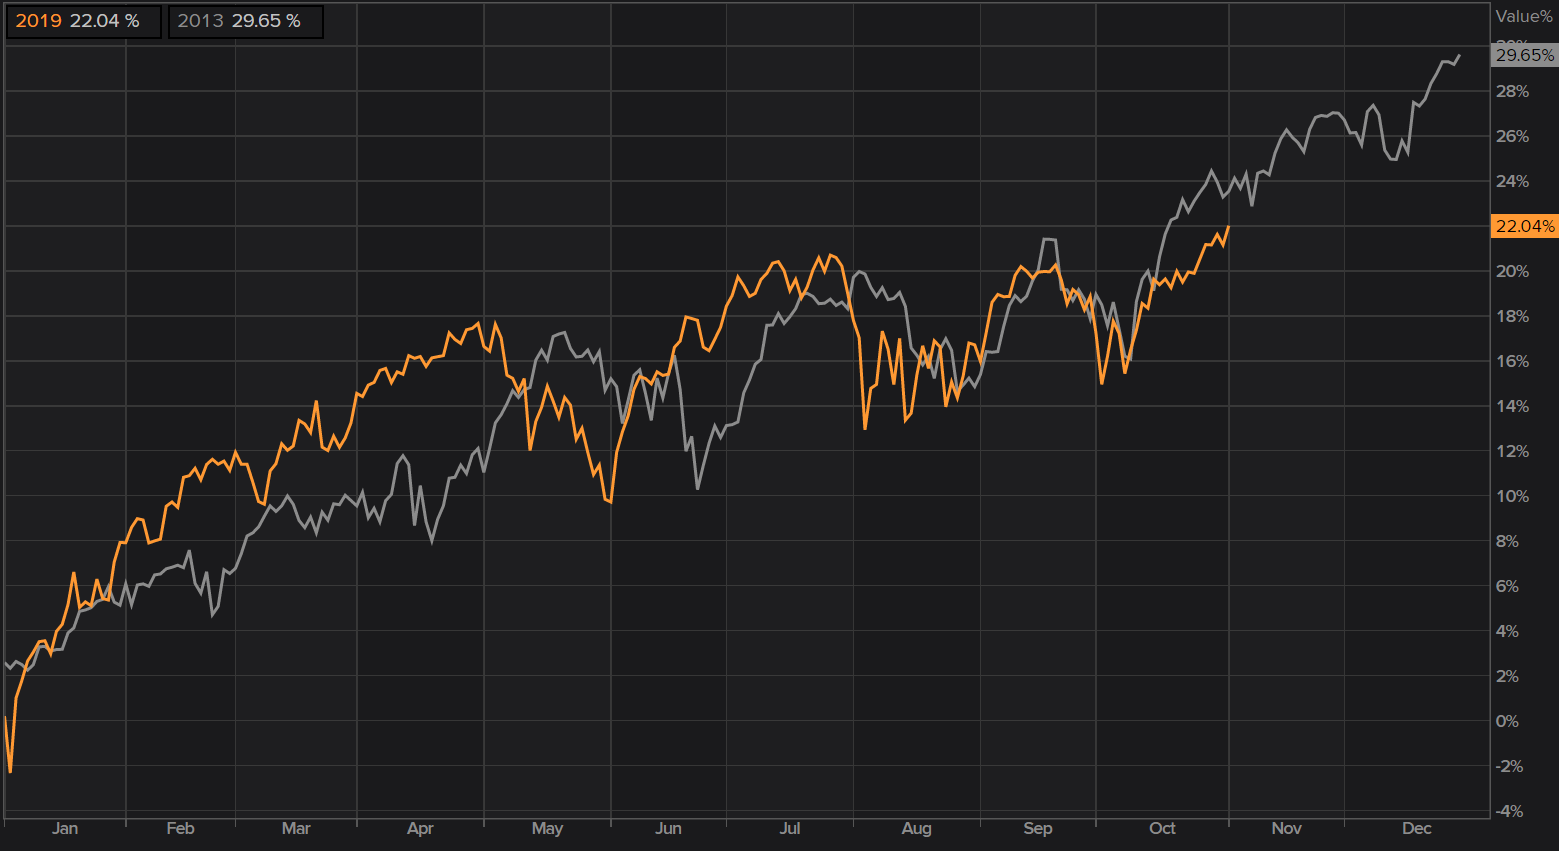
- The Market Ear – Seasonality (2) – the S&P 2013 perfect pattern continues
But there is one risk though. The specter of a recession must not cast a dark shadow on the stock market the way it did on Thursday following the dreadful 43 on the Chicago PMI. But as the stock market showed on Friday, it doesn’t need a strong number; heck it doesn’t even mind what used to be termed a recessionary sub 50 ISM number as long as the reported number is higher than what was feared. If you don’t believe it, look at what a 48.3 ISM number did to the stock indices at & post 10:00 am on Friday:
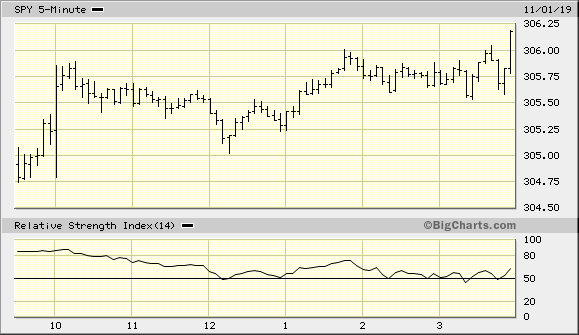
Frankly, the stock market seemed like a horse surging at the turn to the wire in the Kentucky Derby.
- Lawrence McMillan of Option Strategist – In summary, this is about as bullish as a complete set of indicators can get. But things can change quickly, especially in these days of tweets and trade wars. So, do not become complacent. Roll profitable long calls up to higher strikes, and pay attention to the indicators for any change of direction
What is another indicator for a rally?
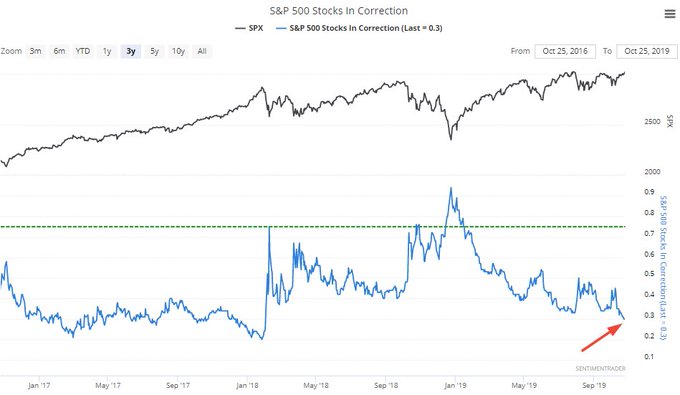
- SentimenTrader@sentimentrader – The % of S&P 500 stocks in a correction has fallen to 30% for the first time in more than 100 days. The 9 other times this happened, $SPX was higher 9 out of 9 times both 6 months and 1 year later
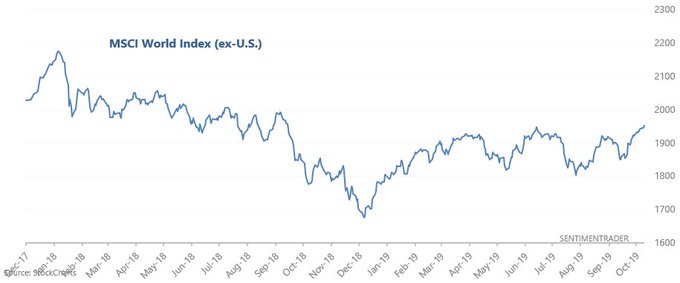
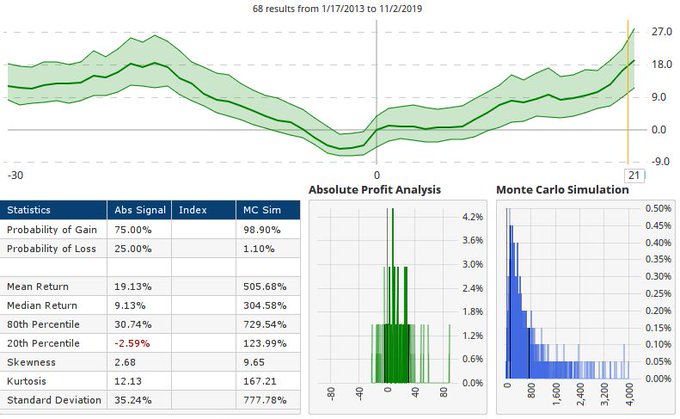
Is there a similar indicator for stock indices outside the USA?
- SentimenTrader@sentimentrader – MSCI World Index (ex-U.S.) recently broke out to a new 1 year high. When it did so in the past, ex-U.S. stocks went up 100% of the time 3 months, 6 months, and 1 year later sentimentrader.com/blog/smart-mon
Now that doesn’t mean that we are euphoric or that we don’t see that the S&P is close to being overbought. In fact, there is a similar indicator that suggests a better buying opportunity ahead:
- Andrew Thrasher, CMT@AndrewThrasher – When the $VIX closes under 14 and its 20-day MA but higher than the last 4 days (like it’s setup to do today), it’s been higher within the next month 75% of the time since 2010.
So did the Fed escape this meeting without making a mistake like in October 2007? We don’t know if they did so verbally but we do think they did so via their continued increase in the Fed’s balance sheet via “Not QE”.
2. Treasury rates
Despite the above, the big asset class that rallied the most was long maturity Treasuries. TLT, the Treasury ETF, was up 1.6% while the S&P 500 was up 1.5% and EDV, the Zero-coupon ETF, was up 2.2% while the Russell 2000 was up 1.9%.
The 30-year yield fell by 9 bps on the week; the 10-yr yield fell by 8 bps, the 7-5 year curve by 7 bps & the 2-3 yr yields by 7 bps. And this is despite a near melt up in the stock market.
As we wrote earlier, Rick Rieder of BlackRock sees the front end of the yield curve as very attractive. But he doesn’t care much for the 10-year. In contrast, Bob Michele of JP Morgan Asset Management said Buy 10-year at 1.7% without question on Bloomberg Real Yield on Friday. Priya Misra of TD Ameritrade also prefers to buy long Treasuries instead of lower quality credit. And they both think the 10-year will close 2019 at a lower yield than on Friday. Of course, a larger number of experts disagree.
3. The Trump Narrative & the US Economy
We refer interested readers to our adjacent article titled Trump & S&P 500 – From Tale Risk to Narrative Economics of Robert Shiller.
Send your feedback to editor@macroviewpoints.com Or @MacroViewpoints on Twitter