Summary – A top-down review of interesting calls and comments made last week in Treasuries, monetary policy, economics, stocks, bonds & commodities. TAC is our acronym for Tweets, Articles, & Clips – our basic inputs for this article.
Editor’s Note: In this series of articles, we include important or interesting Tweets, Articles, Video Clips with our comments. This is an article that expresses our personal opinions about comments made on Television, Tweeter, and in Print. It is NOT intended to provide any investment advice of any type whatsoever. No one should base any investing decisions or conclusions based on anything written in or inferred from this article. Macro Viewpoints & its affiliates expressly disclaim all liability in respect to actions taken based on any or all of the information in this article. Investing is a serious matter and all investment decisions should only be taken after a detailed discussion with your investment advisor and should be subject to your objectives, suitability requirements and risk tolerance.
1.Positives?
Positives in a week which featured a worse weekly decline than 2008 with Dow down 17%, with a 13% fall in high yield credit ETFs & with a 29% fall in Oil? Positives in a week in which the markets threw sand in the Fed’s face completely discarding their huge stimulus measures?
Yes, at least to our simple way of thinking. We measure the impact of Fed’s liquidity injections in a very simple & intuitive way. If the Fed’s liquidity is beginning to take effect, then the leveraged closed end funds should do better than the unleveraged ETFs in the same asset class. Of course, that did not happen this week. Look HYG & JNK, the high yield unleveraged ETFs, were down 13% on the week while DPG, the leveraged closed end credit fund, was down over 23%. So the Fed continues to fail to get respect from markets, right?
Before you say yes, look at the DPG vs. HYG chart for the past 2 days of this past week.
Is this real? Yes, DPG rallied 37.5% on Thursday & another 5.7% on Friday. But that is not our main interest. Look at the 5-day chart of DPG vs. HYG for the entire week:
Notice that DPG began its outperformance over HYG on Thursday, March 19. Was that due to Jeffrey Gundlach who said the following on Tuesday evening in his webcast?
- “There are no opportunities for you now except maybe in closed-end funds, … Closed-end funds were trading at premiums but are now down 30% and are trading at huge discounts.”
Scott Minerd of Guggenheim, now the voice of eternal doom, said on CNBC FM that,
- “… municipal bonds, selected asset backed securities … those are the places we are finding real value where you are getting paid more for the risk than the actual risk you are taking on … starting to get that sense of panic in some parts of fixed income … forced liquidation … “
Last week we had pointed out the carnage in NAN, a Quality NY Muni closed end (leveraged) fund from Nuveen. Well, NAN was down 11.7% this week vs. the 8.3% fall in MUB, the unleveraged Muni Bond ETF. But take a look at the 5-day chart for this past week:
Notice the big outperformance of leveraged NAN over the unleveraged MUB from Thursday morning. Isn’t this just like the above DPG outperformance over HYG from Thursday?
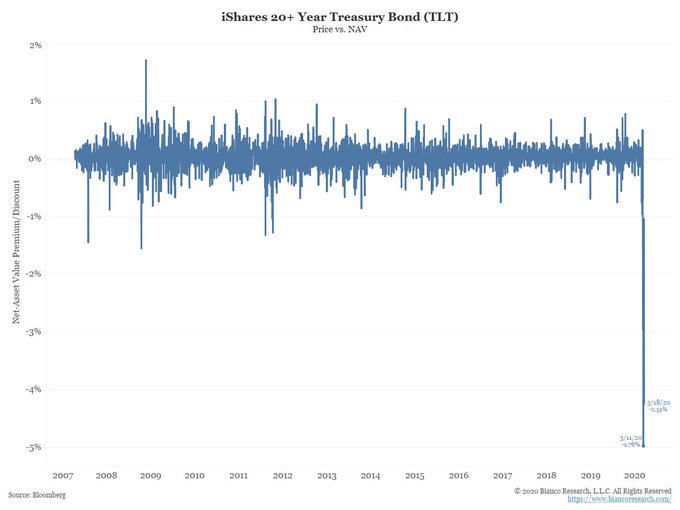
But wait a minute. Doesn’t the entire fixed income market trade as a spread over the “risk-free” Treasury rates? So how does the fixed income market get back on its rails until & unless the Treasury market begins to function properly? Forget properly. Dysfunctional is how a really smart guru described the Treasury market on Thursday, March 19.
- Jim Bianco@biancoresearch – Mar 19 – Why did the Fed boost QE to $75 billion a day? The dysfunction in the Treasury market is arguably as bad as it has ever been. Here is one measure of that dysfunction. Notice how it was not a problem in 2008 and is a massive problem now.
But guess how TLT began behaving as Jim Bianco tweeted the above? Look at its 5-day chart:
Well, TLT actually began rallying some in the last hour on Wednesday but it rallied seriously from Thursday morning. How did rates behave? The 30-yr yield & the 10-year yield fell about 8 bps on Thursday & by an accelerated 27 bps & 24 bps resp. on Friday.
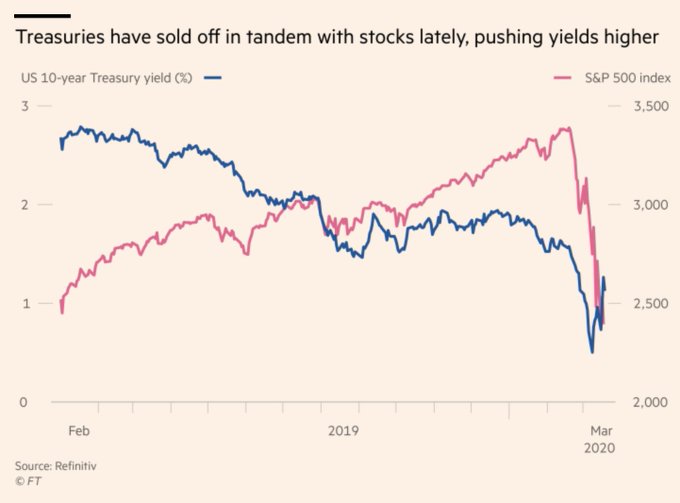
Another departure from recent norm has been TLT selling off as stocks sell off. So how did TLT trade vs. the S&P last week?
TLT clearly made its weekly low on Wednesday late afternoon & rallied strongly for the rest of the week. But the S&P showed failed rallied & went back on Friday afternoon to touch its Wednesday low. Note the cross of TLT over the S&P in the last hour of Friday. Very different from Wednesday, right?
What had made Treasuries fall in tandem with stocks over the last month?
- Jesse Felder@jessefelder – “These moves suggest a rapid unwind of leveraged strategies like risk parity.” ft.com/content/4d5cac
So given all the above, a natural question is whether Risk Parity style also made a bottom On Thursday, March 19? In this case, let us look at the 1-month chart of RPAR, the risk parity ETF:
Not only does the above show the waterfall decline over the last 2 weeks from March 9, but it also shows that Thursday, March 19 did mark a bottom & a turnaround. And the turn on Thursday was consistent across different asset classes.
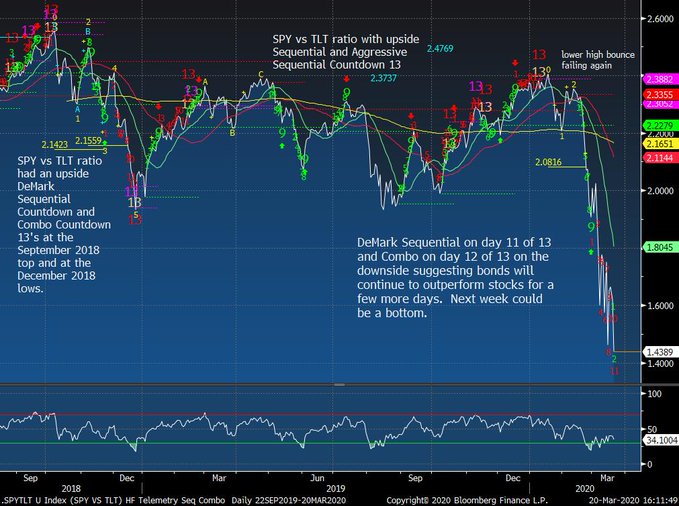
We know that two days don’t make a trend. But two days are better than none. We are merely showing a positive that we noticed in a horribly bad week. We simply want to enjoy it for this weekend. On the other hand, a smart DeMarkian suggests a change might be imminent:
- Thomas Thornton@TommyThornton – This has been a great guide in the last few years for tops and bottoms we’ve highlighted onhedgefundtelemetry.com. $SPY vs $TLTratio daily with near downside DeMark Sequential and Combo buy Countdown signals! Next week might be a bottom or perhaps the bottom!
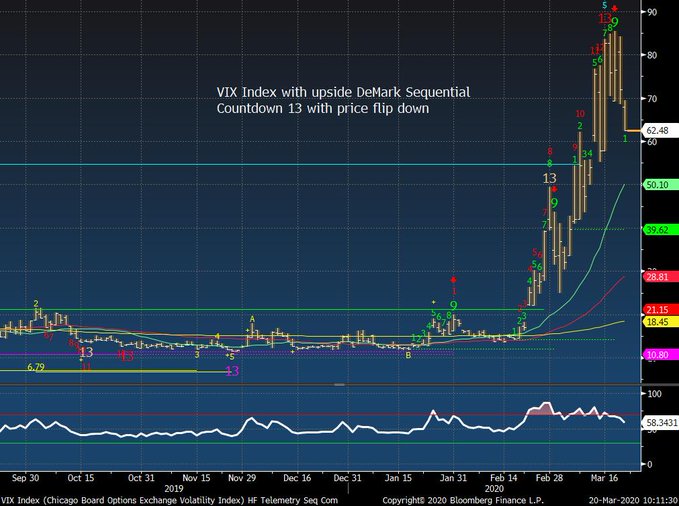
But what about that measure of fear in stocks? How did it behave this past week?
Guess what? VIX made a top for the week on Thursday too? And a smart DeMarkian read something more in that as he did in the SPY-TLT ratio:
- Thomas Thornton@TommyThornton – $VIXwe showed this several days back at the peak with the upside DeMark Sequential sell Countdown 13 onhedgefundtelemetry.com
An old dictum in investing is to never ask “why”? It usually proves to be a very expensive question. Frankly, we don’t care why all these asset classes made local extrema on Thursday. But the big deal is they did & a huge deal if these extrema hold.
However it is human to wonder why and inquiring minds make a habit of that, right? And something extreme did happen on Wednesday. Not just a local extreme but possibly an extreme for a while. The outburst by Bill Ackman on CNBC Half Time on Wednesday. No wonder VIX made a peak on Wednesday afternoon. Did that end up triggering the end of Ronin Capital?
2. Stocks – Short Term & Long Term
Let us be clear. Our views above are simple & could easily prove to be specious, especially about stocks. CoronaVirus is the biggest near term concern in the stock market as we saw after Gov. Cuomo’s declaration on Friday morning. A 444 point rally turned into a 913 point fall by the close. And after hours was ugly too.
- Jim Bianco@biancoresearch – S&P fut trade after the NYSE close. They tanked another 40 points (~2%). Just traded a new low for the entire move lower, 2,260. 50/50 odds that by Monday’s open, a ban on some combo of short selling, inverse ETFs (liquidation only). Index fut/options. The 2008 playbook.
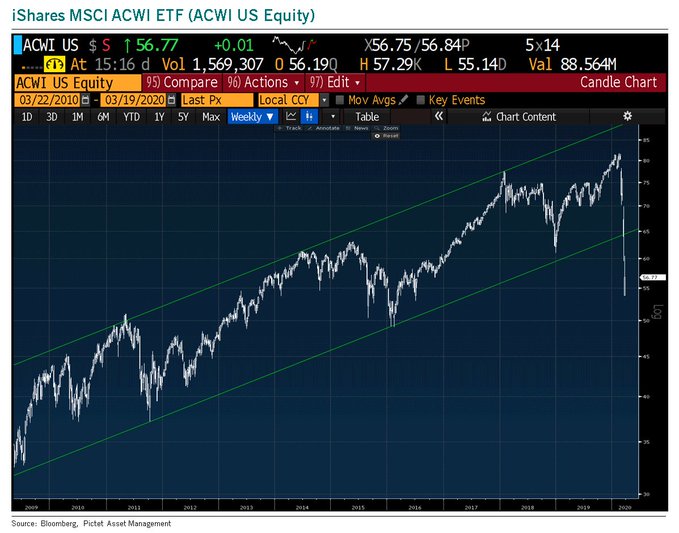
Then we have a trend break:
- Julien Bittel, CFA@BittelJulien – – I hate to sound alarmist after a 30% plunge, but global equities broke trend last week. While a retest of previous support seems likely given the degree of bearish sentiment, this breakdown is significant & will likely result in a deeper correction over the coming months.
Then you have the wrong kind of sentiment:
- Richard Bernstein@RBAdvisors – #Bearmarkets have 3 stages: 1) it’s temporary; 2) it’s worse than anyone could have imagined; and 3) it’ll never end. Judging by the reports in my inbox today it seems we’re moving from Stage 1 to Stage 2. Still too many trying to time the #bottom, so Stage 3 still seems far off
Jim Bianco has made the same point. Scott Minerd of Guggenheim made the same point explicitly & with some passion. He said we are in the value zone but that value is a poor timing tool. He added that he sees another 10-15% downside from here. Hear him explain his views on CNBC FM on Thursday evening:
On the other hand, don’t stocks move because of a tussle between sellers & buyers? One question is how many big sellers remain after the carnage we have seen already in a down 30% from the high stocks market? One guru was clear on Friday:
- Douglas Kass@DougKass – We are through margin selling. @realmoney Snapper?
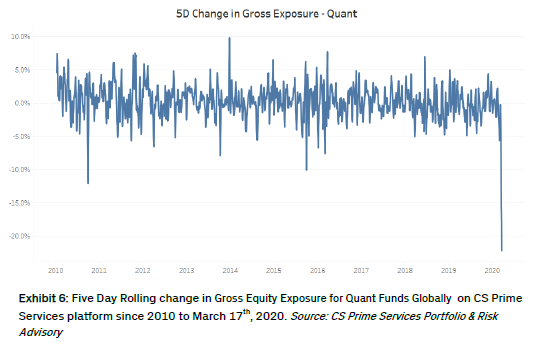
Another group has little left to sell?
- THE LONG VIEW@HayekAndKeynes – Quants finally capitulated
Then you have the summary of potential buying demand coupled with selling exhaustion courtesy of The Market Ear:
- “end of month 15-20% upside? – MS QDS argues for a 15% to 20% counter-trend rally over March month-end now that the system is completely reset (HF grosses and nets at virtual all-time lows, systematic strategies completely delevered (some even short) and >$1T sitting in money markets) with pension fund + asset allocator demand (~$160B) and today’s expiry helping to serve as a clearing event. With this flow generally starting roughly 5-days before month end and peaking at the end of the month, it should build by mid next week. If Congress can get a proper stimulus plan in place and if virus trends don’t surprise an already concerned market, there could be meaningful upside to equities (15% to 20% is likely possible) over March month-end“
With all this, wouldn’t it be smart & timely for our friends at CNBC Squawk Box to get Nomura’s Charlie McElligott early next week for his views? After all who can articulate “Dealer Gamma” better than him?
3. Fed
Simply put,
- Bob Lang@aztecs99 – a trillion a day by the fed — they are not effing around anymore.
A more quantitative way of putting it:
- David Rosenberg@EconguyRosie – After today, the Fed has conducted 15 actions since the crisis began. It wasn’t until July 30th, 2008 or the eighth month of the Great Recession, that it got this aggressive. This time it’s been lumped into month one.
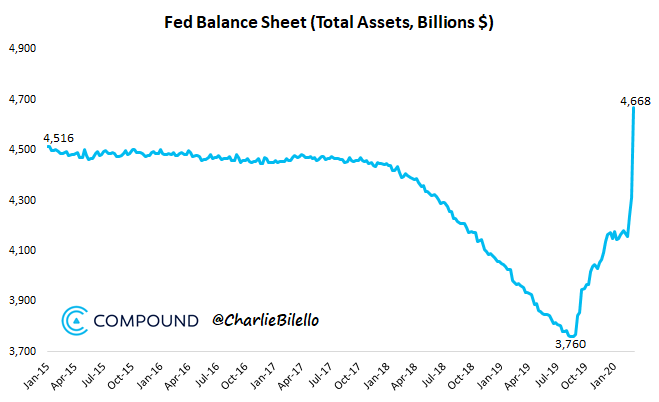
That is one measure of speed. What is another?
- Charlie Bilello@charliebilello – Fed balance sheet moves up to $4.668 trillion, a new high. In the last week it increased $356 billion, the largest weekly increase ever (prior record was $292 billion from Sep 24-Oct 1 in 2008).
But when does all this begin to move the markets in the right direction? When we see some lessening of panic over CoronaVirus, especially in New York City.
We do think we are near an upside move that might be sharp & surprising. But we don’t think that sparks a new bull market at least not without much more pain. We will see ups & downs in global equity markets until a final bottom is reached. That was the lesson of 2001-2002 & of 2008-2009.
Our macro view is that this CoronaVirus is a huge & transformational event that will lead to a global slowdown & prove an agent of change for the world order (Consuming nations >>> Producing nations being one). But that is a topic for a later date.
Right now, everybody would settle for a near term rally that takes the panic down.
Send your feedback to editor@macroviewpoints.com Or @MacroViewpoints on Twitter