Summary – A top-down review of interesting calls and comments made last week in Treasuries, monetary policy, economics, stocks, bonds & commodities. TAC is our acronym for Tweets, Articles, & Clips – our basic inputs for this article.
Editor’s Note: In this series of articles, we include important or interesting Tweets, Articles, Video Clips with our comments. This is an article that expresses our personal opinions about comments made on Television, Tweeter, and in Print. It is NOT intended to provide any investment advice of any type whatsoever. No one should base any investing decisions or conclusions based on anything written in or inferred from this article. Macro Viewpoints & its affiliates expressly disclaim all liability in respect to actions taken based on any or all of the information in this article. Investing is a serious matter and all investment decisions should only be taken after a detailed discussion with your investment advisor and should be subject to your objectives, suitability requirements and risk tolerance.
1.Looking back to April 30
Quite instructive that look back! Remember that Charlie McElligott (CM) termed April a “reverse dispersion month” and said in his @Macrovoices podcast:
- “So what we look at right now is the sentiment index that looks at a number of metrics from, you know, momentum, credit spreads, vol indicators, technicals. We have currently are running a score that since 2004, this US sentiment index is 99.6 percentile. Extreme, extreme, extreme, high, high sentiment across all of these various metrics, right.”
And what happens when sentiment is so extreme high for the next several weeks? CM said:
- “You’re really going to get some chop. And that, you know, we can speak to that later as far as kind of my more medium term, you know, one to three months view. A lot of these back tests tell us that there’s some chop coming with regards to themes, you know, between assets, sectors, and industries. … So it’s just kind of like this grinding 70 bps expected return when sentiment is this high. “
That is exactly what transpired in the past three weeks – S&P down 60 bps, Dow up 90 bps, TLT down 69 bps. Yes Copper is still up even after this week’s fall. Oil is nearly the same. The index with a real fall is Nasdaq 100 (QQQ) down 3.2% & Gold is the biggest winner, up 6.4% . But there is still one week to go in May before we measure the 1-month anniversary of the April 30 calls.
Also on April 30, we featured the call for caution of Carolyn Boroden as communicated by Jim Cramer:
- “she is raising the caution flag with the fatigue setting in & points to the next window for a pullback is in May (this week was her first window); her downside target is 4012 & if that is broken then to 3720 support … what’s her cue – if the 5-day exponential moving average of S&P crosses below the 13-day emv, then its the cue to get out of Dodge …”
The 5-day exponential moving average did cut below the 13-day on Tuesday May 11 and look what happened on that Tuesday & Wednesday May 12. The SPY touched 4050 (50-day simple moving average) if not the Boroden’s 4012 level and bounced hard. It came close to touching that level this Wednesday morning and bounced.
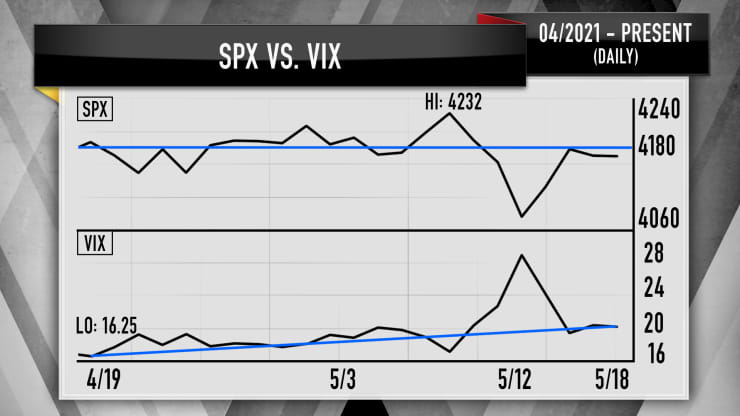
What about the VIX? Lawrence McMillan of Option Strategist wrote this Friday:
- “Volatility has seem some wild action in the past week, in terms of $VIX movement. $VIX spiked up to the 28-29 area during the heavy selling of May 12th and 13th. Then it gave a “spike peak” buy signal on May 13th. That signal was stopped out on May 19th, and is in the process of setting up again.”
Wait a minute. If these VIX spike signals don’t even last a week, are they really “spikes” or do they represent a “swell”? According to Mark Sebastian, a colleague of Jim Cramer, it is a “swell”. Cramer amplified on this past Tuesday, May 18:
- Since mid-April, the VIX has climbed almost 30% from its lowest close. The S&P 500 is down almost 0.5% in that same period. … “A flat market with a rising VIX is exactly what you see at the beginning of what’s known as a volatility swell,” Cramer said. “According to Sebastian, this is when the VIX rises for an extended period of time, usually 2 to 6 weeks, and the market has a genuine correction.”
From what we gathered while listening to Cramer, this correction would be over by July. This brings us to Tom McClellan whose clip we featured in our April 30 article. He came on CNBC Closing Bell on Thursday, May 20 to also discuss the “corrective trade” that the market “is in right now“. Looking at it from his seasonality view, he said “it’s a great time to buy low and sell high almost daily between now & late June“. Then we will see a rally into July.
But when he views it from a 1st year of a new President cycle, he expects a mid-June bottom. Actually he wants CNBC guests to sound very negative by mid-June. If that happens, he can see a strong rally beginning around mid-June. But, unlike Sebastien, McClellan expects this rally to end in a July top.
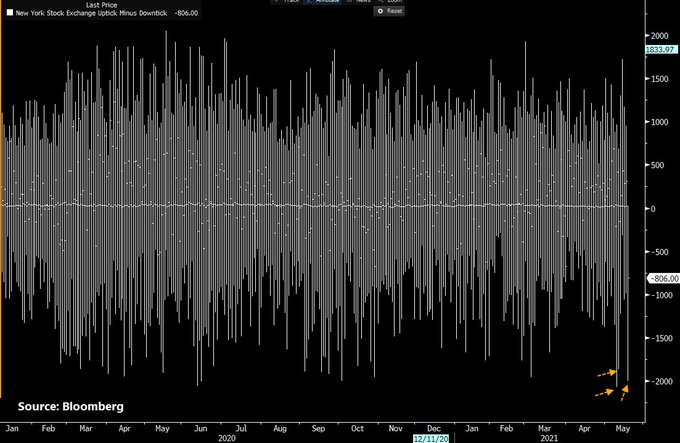
We might have been inured to these weekly falls & rallies to end the week in a flattish manner. But no one can deny the ferocity of the selling pressure we have seen in the past two weeks. That is borne out by:
- SentimenTrader@sentimentrader – May 19 – In the past 7 sessions, stocks have suffered 3 of the largest bouts of concentrated selling pressure in history. May 11: Largest all-time Today: 5th-largest May 12: 19th-largest
So what about next week? We all saw the massive fall in Bitcoin this week. Remember what Tom McClellan said in the clip we featured in our April 30 article that dance movements of Bitcoin show up in stock movements the following week even though the magnitude of the moves are not the same. So he would not be surprised if stocks fall next week, he pointed out this week.
Even bullish Tom Lee raised the possibility that “the market may lose all underlying buying because all the money is on the sidelines“. How much money is on the sidelines? Tom Lee said,
- “Institutional money market cash now is $3.065 trillion. That’s essentially within a hairbreadth of the highs of May 2020. Hedge funds & Institutional investors have raised so much cash .. that the dry powder on the sidelines is where it was last year;”
Going back to Carolyn Boroden’s warning from our April 30 article about “5-day exponential moving average of S&P crosses below the 13-day emv”, we would like to point out that the 5-day is now very close to touching the 13-day emv from below. What if the 5-day emv actually breaks out above the 13-day next week? Would that close out the negatives Ms. Boroden saw three weeks ago? Will Jim Cramer educate us with even just a tiny comment?
Now back to Tom Lee and the dry powder he sees on the sidelines. His call:
- ” … the odds are favoring a melt-up; So as long the economic melt-up continues … we can have a melt-up; there has been a lot of consolidation the last couple of days but I think it is a precursor to a melt-up higher in equities“
But Lee does not see a strong rally in QQQ or Nasdaq 100 stocks. He think QQQ is likely to touch 300 first and he points to what happened to Bitcoin this week as a possibility for QQQ because of the concentration of investors in big tech stocks.
On the other hand,
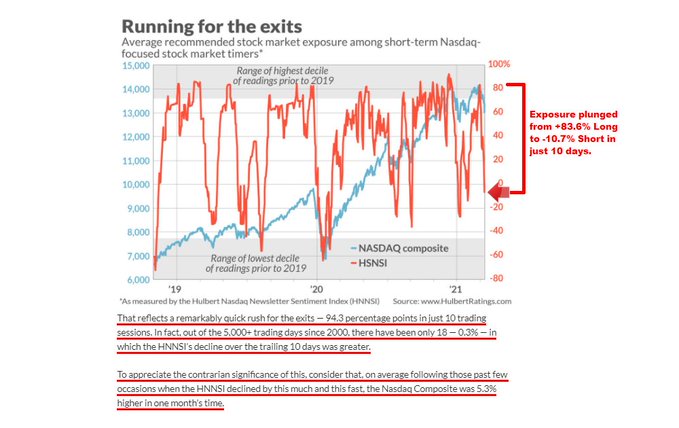
- Macro Charts@MacroCharts – May 19 – Everyone has a foot out the door: • Nasdaq Newsletter Exposure has plunged at one of the fastest rates in history. • “That reflects a remarkably quick rush for the exits” • Previous cases led to the Nasdaq gaining +5.3% over the next month on average – watch closely.
2. Bonds
All of a sudden, we saw several non-negative comments on US Treasuries this week. On Monday, we saw:
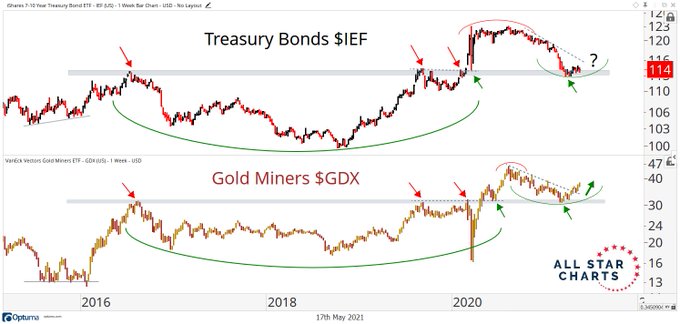
- Steven Strazza@sstrazza – May 17 – Do Treasury Bonds rebound and rally off their 2016 and 2019 highs like Gold Miners just did?$IEF $GDX
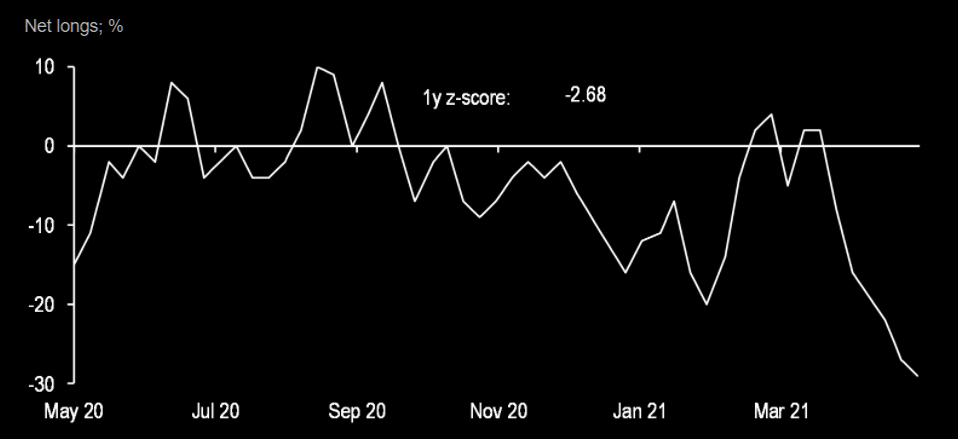
On Tuesday we saw
- The Market Ear – US Treasuries: record short – At least they talk the talk…..The JPM “Treasury Client Survey” shows record shorts in US Treasuries.
Then weaker than expected economic data caused a 5 bps fall in the 30-5 year curve. And we saw,
- Ryan Detrick, CMT@RyanDetrick – May 20 – Inflation, inflation, inflation
Then on Friday, Tom McClellan published his article titled Pause Coming For The Rise In Interest Rates.
- “The relationship says that bond yields should be reaching a temporary top right about now. The next few months should see a gentle retreat for interest rates, lasting until a bottom due around mid-August 2021. Then a much bigger rise in interest rates is set to commence, if gold’s message continues to be correct about the timing of moves in interest rates.”
But, as Rick Santelli, said this week, the 10-year first has to break 1.6% on the downside.
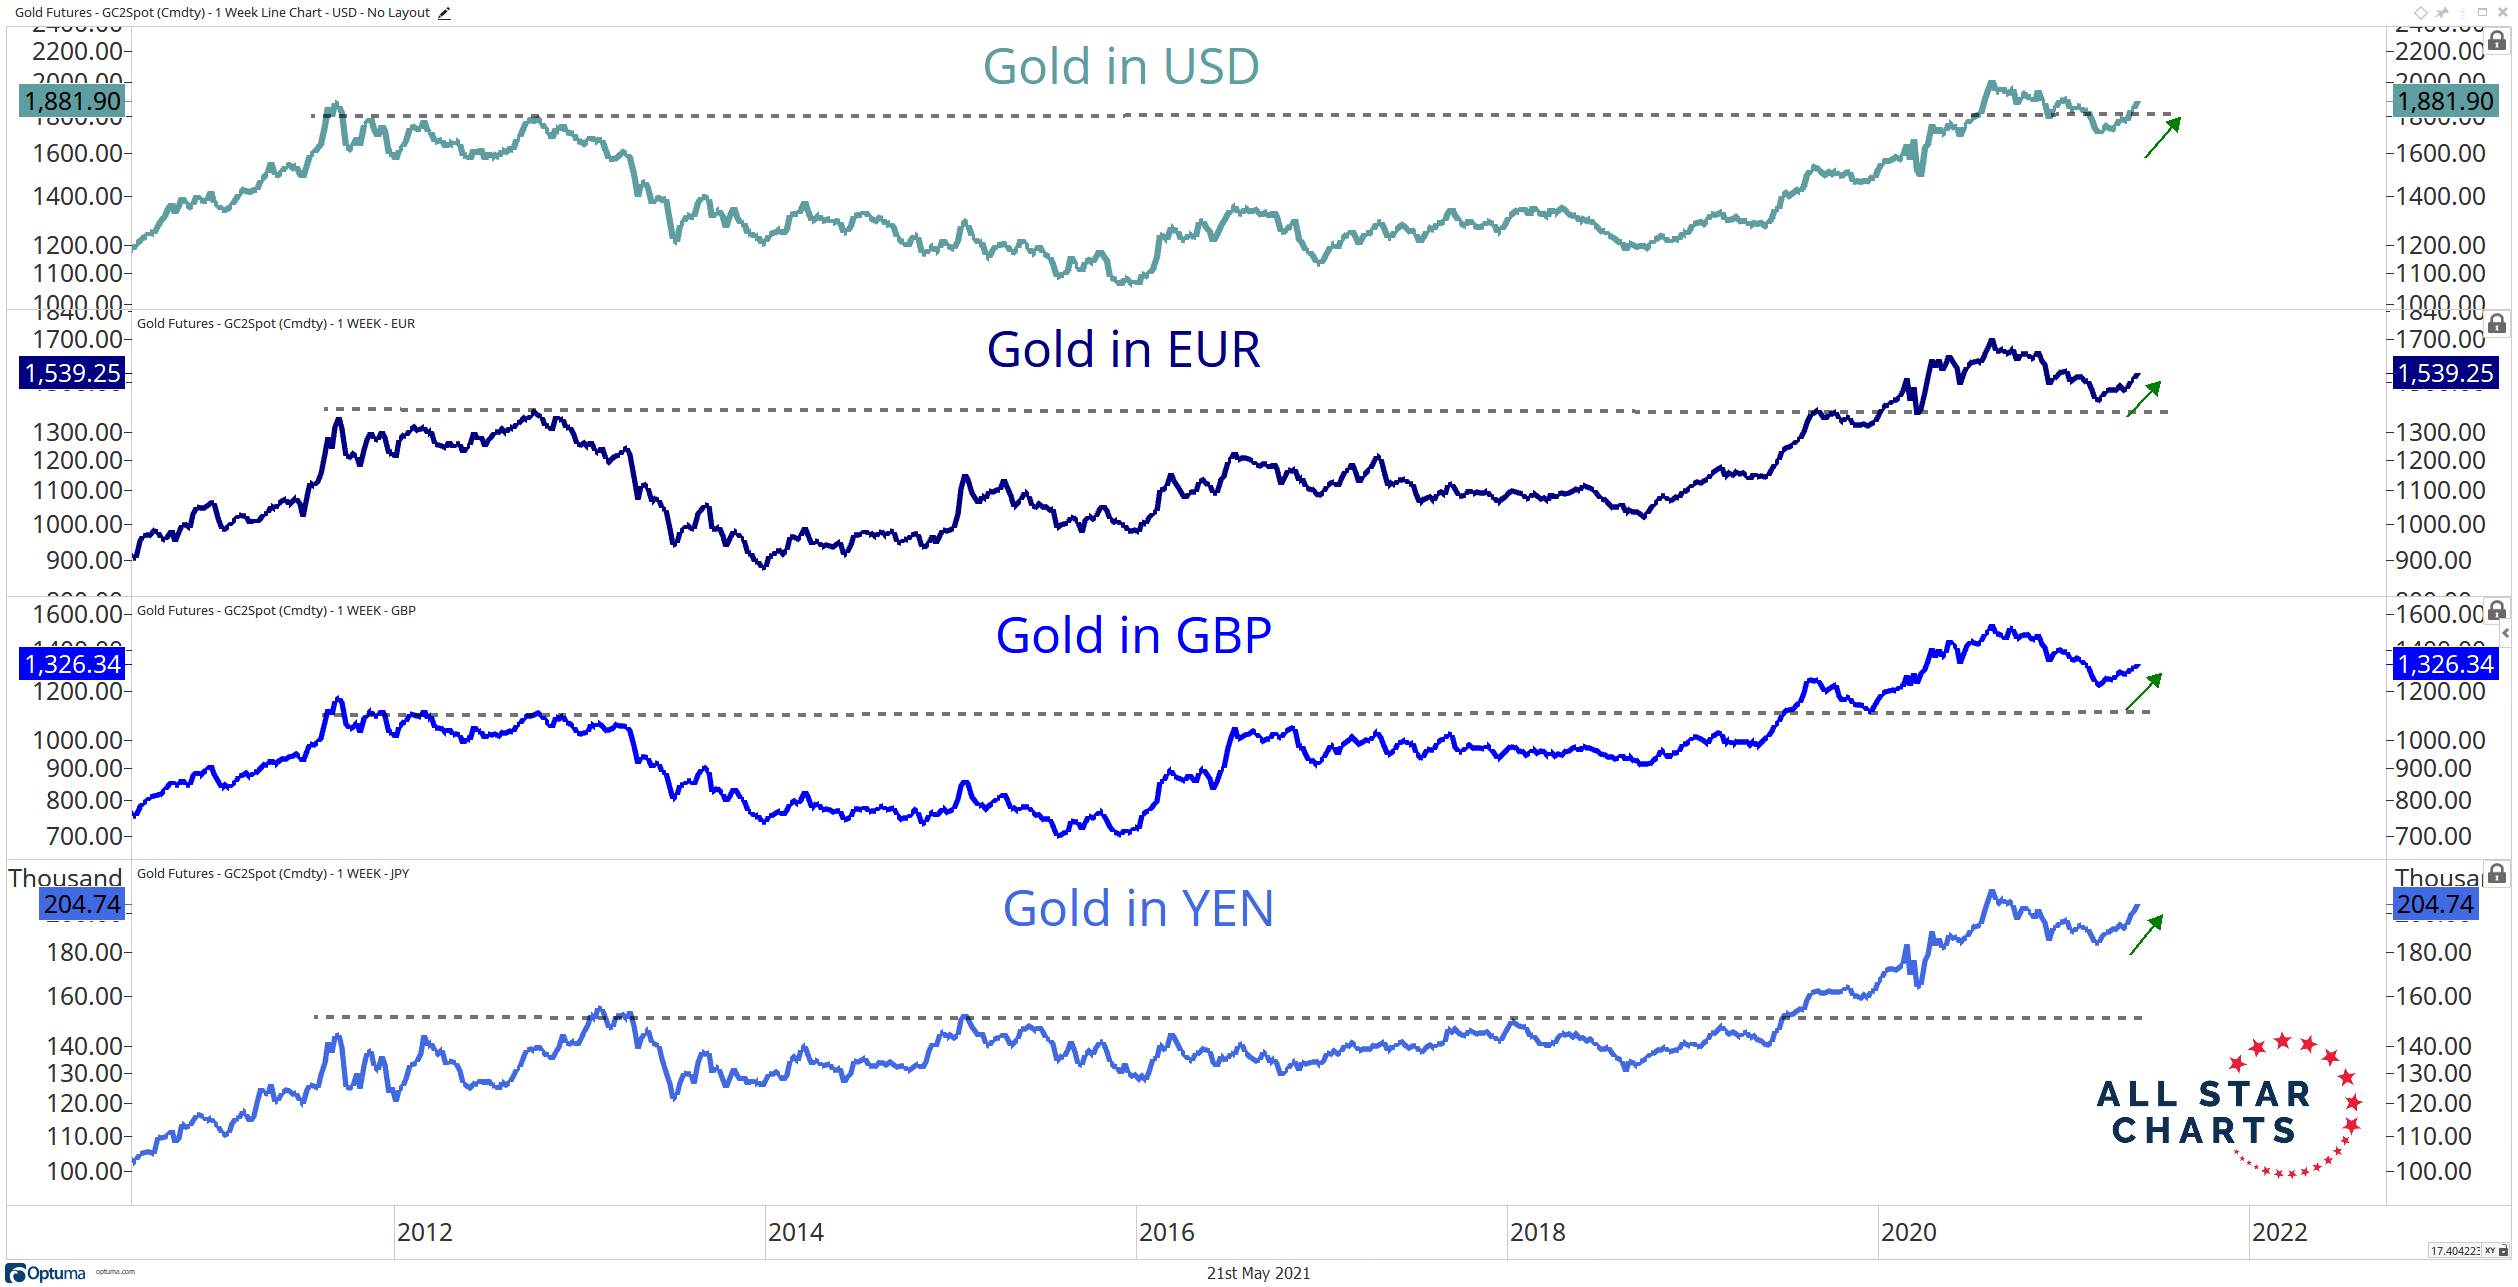
3. Gold
Gold was up 2% this week with the miners, GDX & GDXJ, up 4.7% & 5.6% resp. Tom McClellan was not that positive about Gold. But J.C. Parets said,
- ” … And the trend in Gold is up! All of these are priced in US Dollars, which is the common denominator for most commodities. … But when you take a look at Gold priced in other currencies, it looks MUCH MUCH stronger, … “
4. Ask & Thou Shalt Receive?
A month ago, we asked Indian Stock Market – Is It Time To Get In? We got lucky on that one.
(large Cap EPI vs SPY) (Small Cal SMIN vs IWM)
Frankly, the small-cap outperformance gives us more confidence about the Indian economy going forward. And, if realized, Carter Worth’s call about Dollar falling should be good for all emerging markets.
Send your feedback to editor@macroviewpoints.com Or @MacroViewpoints on Twitter