Summary – A top-down review of interesting calls and comments made last week in Treasuries, monetary policy, economics, stocks, bonds & commodities. TAC is our acronym for Tweets, Articles, & Clips – our basic inputs for this article.
Editor’s Note: In this series of articles, we include important or interesting Tweets, Articles, Video Clips with our comments. This is an article that expresses our personal opinions about comments made on Television, Tweeter, and in Print. It is NOT intended to provide any investment advice of any type whatsoever. No one should base any investing decisions or conclusions based on anything written in or inferred from this article. Macro Viewpoints & its affiliates expressly disclaim all liability in respect to actions taken based on any or all of the information in this article. Investing is a serious matter and all investment decisions should only be taken after a detailed discussion with your investment advisor and should be subject to your objectives, suitability requirements and risk tolerance.
1.is a recycled count like a false breakdown?
When a stock, sector or index falls below a key support, technicians call it a breakdown. That is a serious condition & one that suggests the beginning of a serious down move. But sometimes the break below support gets reversed very quickly and the stock/sector/index rises above the previous support line. Such a false breakdown is deemed bullish & often results in a powerful up move leaving those who sold or shorted looking stupid & feeling poor.
Tom DeMark is a highly respected market analyst & his DeMark counts are studied & followed by many major investors. Just last week Jim Cramer highlighted DeMark’s warning of a Sequential 13 count and said a major top in the S&P 500 & QQQ might be likely.
In this case, DeMark’s “13” count did hit on Thursday, August 4, two days after the Jim Cramer clip. But it seemed to have resulted in a “recycled count”, analogous to a failed breakdown. So said Tom Lee on Wednesday August 11 on CNBC Half Time Report:
- “Today was important because Jim Cramer last week flagged the potential 13 see setup in the S&P in the DeMark system; the “13” appeared on Thursday & it has to respond within 4 periods. Day 4 is today, Wednesday; So unless a sell-off starts today, then it is likely it is a recycled 13. And what that usually means is that instead of a sell, there is a larger trend underway you have to zoom out; and this larger trend is actually a big risk-rally; typical move is something like 7-8% move in 3 months; So this is something that could push S&P towards 4,800 before October. “
We know what happens to the shorts when a failed breakdown reverses into a rally? Is that sort of pressure possible here? Without our asking, Tom Lee said:
- “… investors are cautiously positioned; people were looking for a 10% correction in August and if we have a risk rally, there is a lot of chasing that is going to take place … “
Speaking of a “larger trend underway” that might actually be pushing in a rally direction,
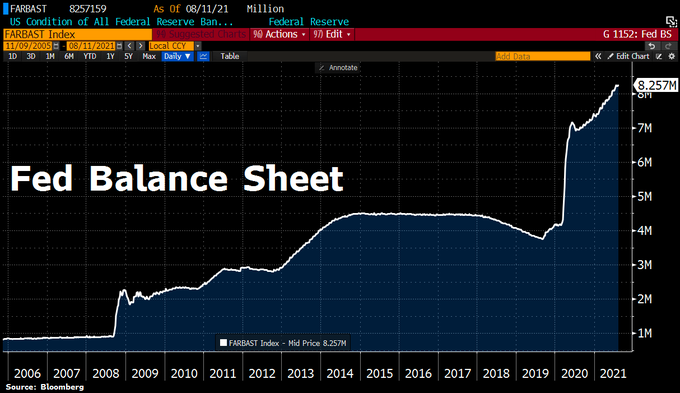
- Holger Zschaepitz@Schuldensuehner – #Fed balance sheet hit fresh ATH as Powell keeps printing press rumbling despite rising inflation. Total assets rose by $22.1bn to $8,257.2bn on QE. Fed balance sheet now equal to 36.4% of US’s GDP vs ECB’s 78% or BoJ’s 133%.
Something else happened this week, something that happens very rarely. By closing up on Friday, the S&P made 4 consecutive highs this week. How rare is this?
- Ryan Detrick, CMT@RyanDetrick – Today could be the 4th consecutive new high for the S&P 500, with all the gains less than 0.35%. This would be the second time this year that happened, entering rare air. Only 1964, 1965, and 2017 have ever seen that happen twice in a calendar year.
Well, 1964, 1965 were before our time. But we do fondly recall 2017.
While one for the record books, the week was fairly quiet. The Dow was up 87 bps, the S&P up 70 bps. But the Nasdaq 100 or QQQ was up 2%. Transports were up 3.9% and Money center banks were terrific until Thursday.
And our favorite VIX was down 4.3% to 15.45 leading Lawrence McMillan to write on Friday:
- The $VIX “spike peak” buy signal of July 20th remains in place. The trend of $VIX remains downward, as $VIX is once again probing towards the yearly lows at 15. $VIX remains below both its 20-day and 200-day Moving Averages.
- In summary, we continue to recommend carrying a “core” bullish position in line with the positive $SPX charts. As long as $SPX remains above support, one should remain long. If support at 4370 is taken out, that would change things greatly. But unless that happens, the “core” long position can be held, trading other confirmed (sell) signals around it.
Yeah, but all that is macro stuff. What about the companies? Here you can see & hear the wonderment in the voice & gestures of BlackRock’s Rick Rieder on Tuesday, August 10 on CNBC Half Time Report – “amount of cash companies are sitting on in unbelievable“. He added that we are going to see significant Cap-Ex, M&A is going to be heavy … and said he is actually increasing his exposure by selling puts in companies that are experiencing high volatility on news. Hear him yourselves:
The only negative note Rieder struck was his insistence that the Fed taper soon to reduce the liquidity in the system. Sorry Signor Rieder, you spoke too soon, 3 days soon before Friday.
2. Last Friday’s NFP & this Friday’s Consumer Sentiment
Think back to Friday, August 6. Treasury rates had fallen from Monday to Thursday of that week only to explode higher by 8 bps or so on that Friday. That was because the Non Farm Payroll shook everybody up with its unexpected strength (or perceived strength if you are a Rosie disciple).
That positive shock carried through this week with rates up from Monday to Thursday. Then came the shockingly bad Consumer Sentiment figures on Friday, August 13. And Treasury rates fell off a cliff:
- Lisa Abramowicz@lisaabramowicz1 – The reaction in bonds: yields head lower.
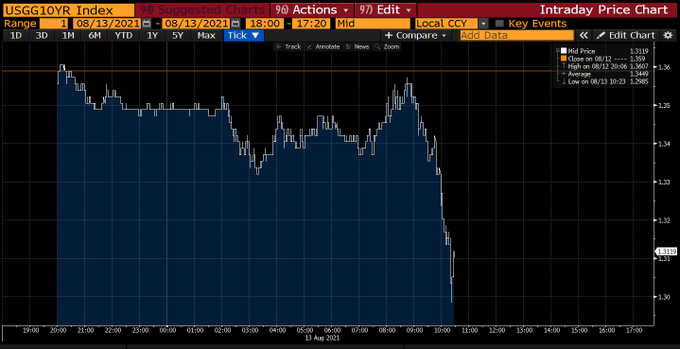
In a virtual mirror image of Friday August 6, Treasury rates fell by 8 bps on this past Friday – 30-yr down 8.9 bps; 20-yr down 8.4 bps & 10-yr down 8 bps. How bad was the sentiment number?
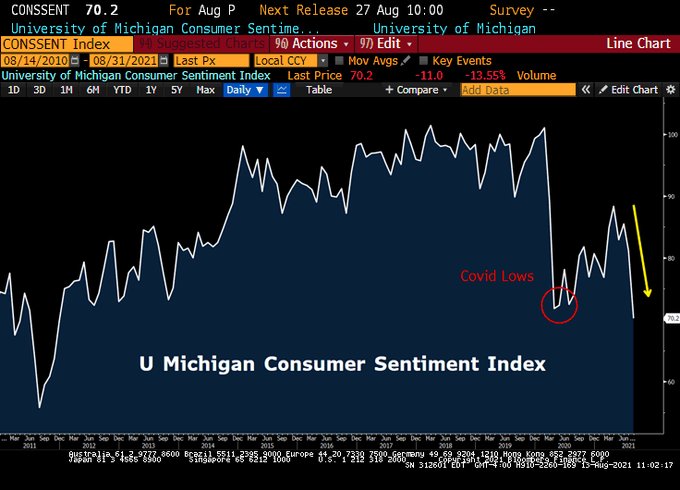
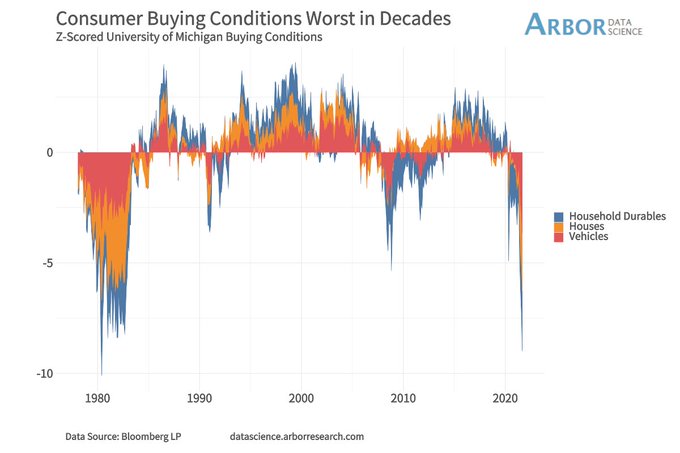
- Lawrence McDonald@Convertbond –This is a colossal shift, on par with 2000, 2008. More than 16 months later, US consumer sentiment is through the Covid-19 lows. Inflation impact on the middle class, impact high, buying conditions for household durables lowest since the 1980 recession.
No one asked Rick Rieder on this Friday whether he still wants the Fed to taper soon. But history seems clear:
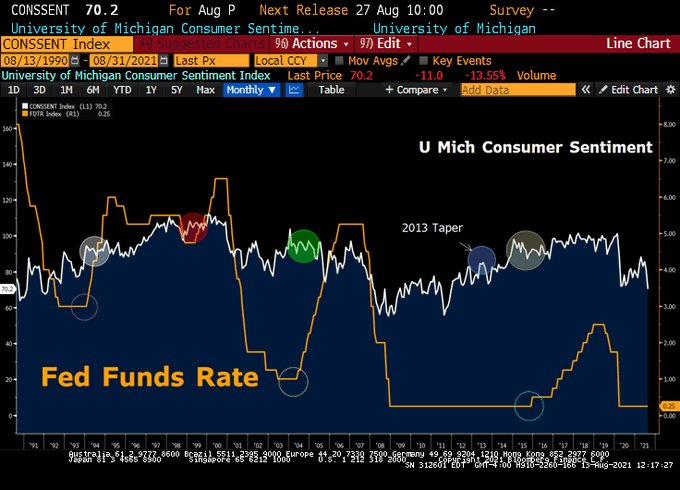
- Lawrence McDonald@Convertbond – Our, inequality-focused, social justice Fed has some explaining to do. In the last 30 years, they have NEVER initiated a pullback in accommodation with consumer sentiment this low. *80s hiking cycles kicked off with readings in the 90s, 1990s as well.
Guess who was on the other side of Rick Rieder about the money boom and that too one day ahead of Rieder?
- David Rosenberg@EconguyRosie – This has received very little play, but the money boom just ran out of gas. M2 stagnated in June for the first time in 3 years and real M2 contracted 0.8% — the history books suggest this could be a recessionary signal.
We are not making fun of Rick Rieder about his “Fed must taper now” call. To our simplistic way of thinking, both Rick Rieder & David Rosenberg are right.
Rieder is speaking about the economy that companies are seeing, the economy in which corporate credit is as healthy as we remember. We heard this week on Fin TV (from BTV’s Lisa Abramowicz if forced to guess) that a Cruise liner company recently raised debt at 5% to repay the debt they had raised last year at 11%. When they see this, credit managers have to get eloquent about the economy.
On the other hand, Rosenberg is presumably speaking about the middle class whose increasing plight can be seen from below:
- Arbor Data Science@DataArbor – The University of Michigan’s Consumer Survey found buying conditions for durable goods, homes, and vehicles are at their worst since 1980.
3. How about reversing the sequence?
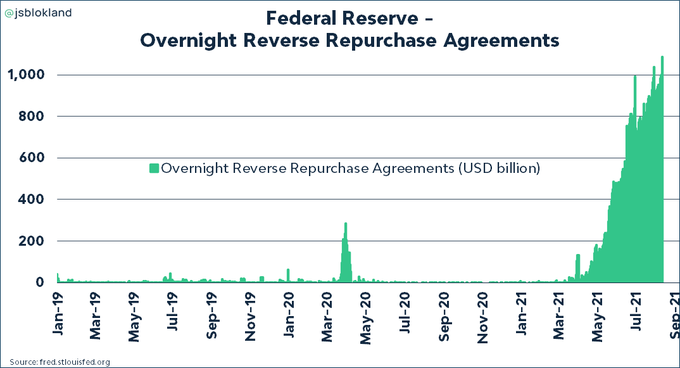
All the smart folks say on Fin TV that the Fed should taper first & then may be in 2023 raise rates. If that remains the case, what might the chart below look like next year?
- jeroen blokland@jsblokland – Wow, chart! The amount of cash parked at the #Fed‘s reverse repo fascility just hit a new record! USD 1.087 trillion!
So why not raise federal funds rates by 25-50 bps now and BEFORE tapering. In fact, it might make sense to raise federal funds rate to 50 bps AND increase the taper to $150 billion a month. Everyone tells us that QE is the key to keeping markets happy & up while raising rates to 50 bps might add some income to savers and reduce this madness of zero% reverse repo at the Fed.
4. Rates & Cyclicals
As we said above, the positive NFP surprise on Friday August 6 made Treasury yields rise from Monday to Thursday of this week. Will the stunningly negative sentiment surprise lead Treasury yields lower next week?
As it happens, the 10-year hit the upper end of its trading band on this Thursday & promptly reversed on Friday. That made Carter Worth, resident technician at CNBC FM-OA, bullish on TLT and on QQQ.
Is that why this week Apple was up 2.1%, Google was up 1.5% and MSFT was up 1.3% with QQQ up 2%?
And any one who bought Wednesday’s 10-year Treasury auction or even Thursday’s lukewarm 30-year auction must feel like celebrating this weekend. The big question is whether Powell will celebrate soon.
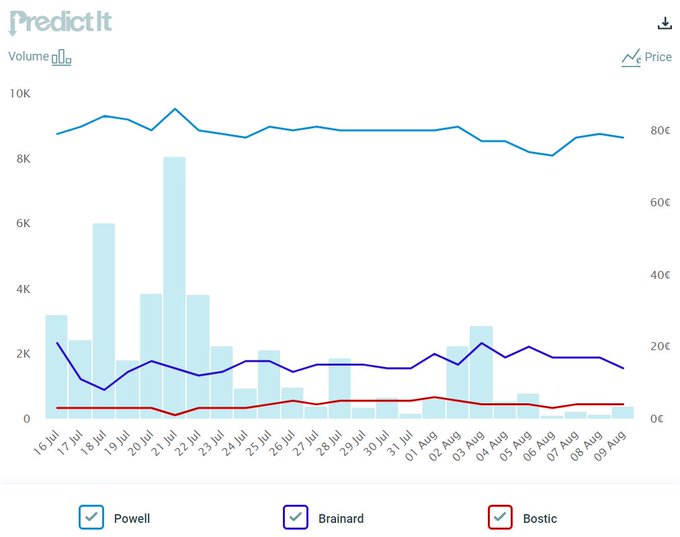
- Jim Bianco@biancoresearch – Prediction markets think Powell reappointment is near 80%.
5. Happy Independence Day
Best wishes to Indian-origin people around the world & holders of Indian stocks for a Happy Independence Day on August 15.
Send your feedback to editor.macroviewpoints@gmail.com Or @MacroViewpoints on Twitter