Summary – A top-down review of interesting calls and comments made last week in Treasuries, monetary policy, economics, stocks, bonds & commodities. TAC is our acronym for Tweets, Articles, & Clips – our basic inputs for this article.
Editor’s Note: In this series of articles, we include important or interesting Tweets, Articles, Video Clips with our comments. This is an article that expresses our personal opinions about comments made on Television, Tweeter, and in Print. It is NOT intended to provide any investment advice of any type whatsoever. No one should base any investing decisions or conclusions based on anything written in or inferred from this article. Macro Viewpoints & its affiliates expressly disclaim all liability in respect to actions taken based on any or all of the information in this article. Investing is a serious matter and all investment decisions should only be taken after a detailed discussion with your investment advisor and should be subject to your objectives, suitability requirements and risk tolerance.
1.Elementary Mathematical Logic?
Two weeks ago we had written
- “… Jim Cramer had highlighted the work of his techni-pal about the bearish signal from VIX rising simultaneously with S&P rising back in the -re-September days. We kinda are seeing the opposite now. …. we are seeing VIX climbing less or less stridently while the S&P falls hard. … And the VIX sell-offs are larger & almost steeper than the VIX spikes.”
Frankly the above is a bit obtuse for simple minds like us. Thankfully a simpler thought occurred to us on Tuesday evening. Elementary Mathematical Logic tells us that if Statement A is equivalent to Statement B, then (negative statement A) is equivalent to (negative statement B).
- Let us define Statement A as “SPY going up with VIX going up” and Statement B as “Bearish”. That gives us the Cramer-Technipal equivalence of Statements A & B meaning that when S&P & VIX both go up, that is bearish. Now logic teaches us that Negative A must be equivalent to Negative B. Ergo “SPY going down with VIX going down” must be equivalent to “bullish”.
If you followed this elementary logic, you realized Tuesday’s action was suggesting you get bullish. Look at this week’s charts of VIX & SPY:
Monday was normal meaning S&P went down hard & VIX rose. Also Wednesday-Friday were normal meaning VIX fell & S&P went up. Tuesday however was markedly different. Dow, S&P and Nasdaq were all down on Tuesday AND VIX went down. Bullish signal? We thought so.
On Wednesday the numero uno factor gave a clear cut signal to get bullish. While the stock indices were lukewarm up, VIX fell 6.60% on Wednesday and closed below 19. QED is what an old Greek guy would have said.
VIX kept falling on Thursday & Friday morning to break below 16 (to 15.72-15.80) on Friday morning. And we know what the stock indices did on Thursday & Friday. That sure made for a terrific week for almost everything:
- Dow up 1.6%, S&P up 1.8% & closed above its 50-day, NDX up 2.2%, RUT up 1.5%, DJ Transports up 3.8%, Semis up 3.3%, Financials up 3-4% on earnings; Dollar down 20 bps; EEM up 2.2%, EWZ (Brazil) up 2.4%, EWY (South Korea) up 3.1%, India ETFs up 3%, Amazon, Microsoft both up 3%+; Oil up 3.3%, OIH up 4.6%, Gold miners GDX, GDXJ up 6% & 7% resp., Copper up 10.6% AND TLT up 2.2% with zero-cpn EDV up 3.1%.
Kudos to the Cramer-Boroden duo who told us on Tuesday October 5 that “we are due for a bounce & today may just be the beginning of that bounce“. But wait a minute. Cramer-Boroden also warned us that they “won’t be putting a ton of faith without a buy signal & for her that’s when the 5-day exponential moving average crosses back over the 13-day emv.”.
Guess what! The 5-day ema closed the week at 440.30 above the 13-day at 438.07. While the cognoscenti like weekly crossovers, we gently point out that the actual crossover of the 5-ema over 13-ema happened on Wednesday. Is that why stock indices exploded on Thursday & Friday?
Regardless of the reason, some see a rally galloping ahead:
On the other hand, did you notice the “almost everything” qualifier for our terrific week list above? The first in that category was the bounce in the VIX to above 16 on Friday afternoon. Will that VIX bounce follow thru on Monday morning? Look back and you will notice that Friday VIX sell-offs below big levels have been reversing on Monday morning.
The bigger factor in our “almost everything bullish” qualifier was the bad action in short duration Treasury rates on Friday.
- The 5-yr yield shot up 6.9 bps on the week, 3-year up 11.1 bps & 2-yr yield up 7.9 bps. In contrast, the 30-yr yield fell 11.5 bps on the week, the 20-year fell 9.3 bps & the 10-yr fell 3.3 bps. This is textbook flattening of the Treasury curve. Actually textbook is such an insipid term for 30-3 year spread flattening by 22.6 bps & 20-2 spread flattening by 17.2 bps in a week.
Wait a minute! Wasn’t the imminent taper supposed to force 10-year & 30-year rates higher? And isn’t the Fed loudly telling us that tapering isn’t tightening of rates? Yeah right, said the Treasury market this week and kicked sand in the Fed’s face. The Treasury market forced 2-3-5 year rates to shoot up (meaning raising of rates) and laughed at the taper by flinging the 10-20-20 year rates down the shute. May be the Fed-communicators play a reverse shutes & ladders game in which ladders make you fall down & shutes throw you upward.
Or is it simply?
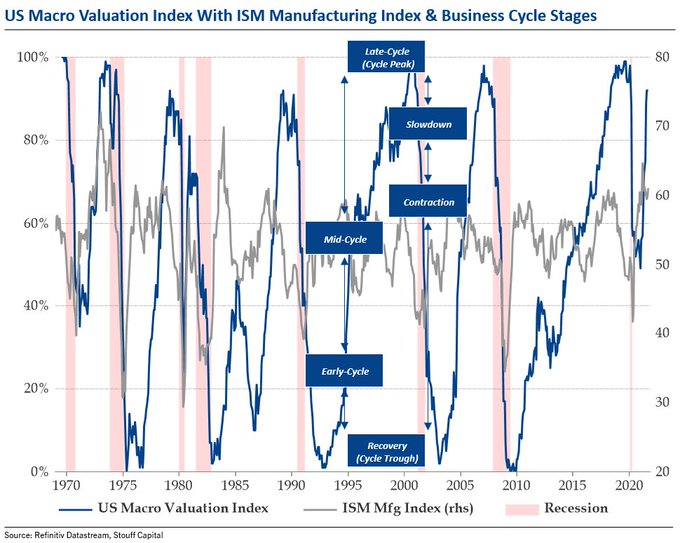
- Julien Bittel, CFA@BittelJulien – – Where are we in the business cycle? My US Macro Valuation Index suggests the cycle is already at a very advanced stage. A cross above 90% has historically signalled a transition from mid to late-cycle. My sense is that we’re further along in the cycle than most people think.
The Treasury market knows that the Fed is consistently wrong in its timing to signal taper-ness and this time it is being even more dumb by signaling rates tightening when households are facing a cold winter & high heating costs:
- Jesse Felder@jessefelder – – ‘The G3 credit impulse suggests that stocks will underperform bonds next year.’ thedailyshot.com/2021/10/14/us- via@SoberLook
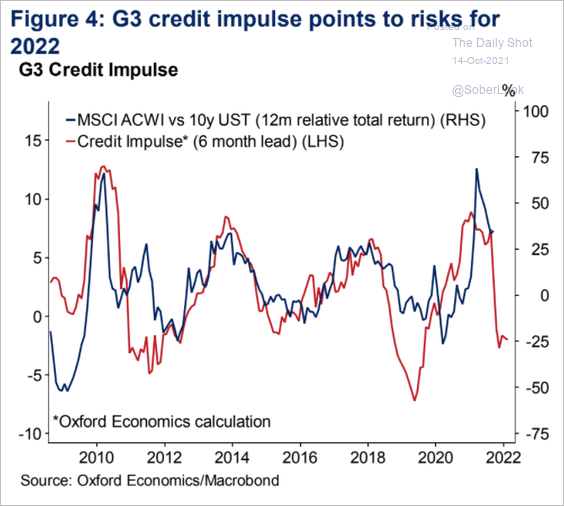
But wait. Wouldn’t bonds have to go up for them to outperform stocks?
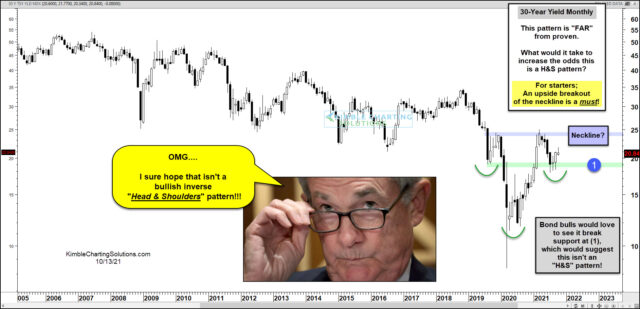
- Jesse Felder@jessefelder – –‘The 30-Year bond yield appears to be forming a bullish inverse head and shoulders pattern. If this pattern comes true, it would have major consequences for the US economy, financial markets, and Federal Reserve.’ kimblechartingsolutions.com/2021/10/is-a-b by@KimbleCharting
But does a bond rally need oil prices to go down or at least stabilize?
2. A proven signal?
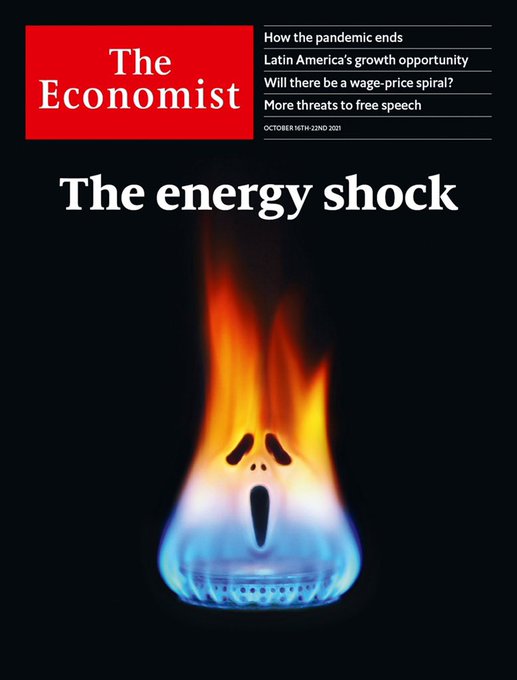
Almost everyone knows that there is no better contrary signal than a cover of the Economist. Remember how or when the oil rally started? Let @Javier Blas remind us:
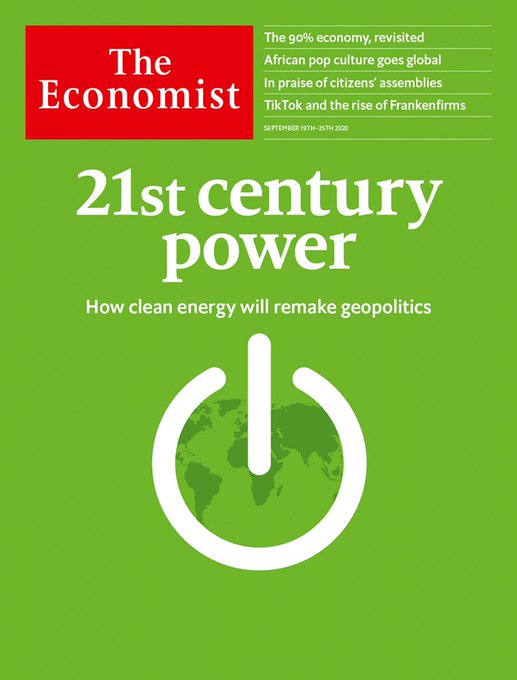
What a perfect contrary signal that was! If you bought oil, oil ETFs or energy stocks then, how are you feeling now?
But are you feeling too happy? More importantly are you looking for a signal to take some profits off the table? This week Signor @JavierBlas highlighted a reversal signal.
The above may be plenty for simple folks but the cognoscenti need other smart stuff like RSI-price divergence, seasonality etc. Below is Jim Cramer communicating the views of his techni-pal Carley Garner:
- “we see multiple technical barriers ahead … unless we get a major positive surprise here, Garner expects the oil rally to exhaust itself right here; … oil does really tend to get hit mid-late October … there is a floor of support at 72, another floor of support at 62 …. “
Watch the charts & Cramer’s explanation below:
Oil is a big force on a secular growth path. So we wondered if there was someone else who could discuss in more detail and ideally suggest an alternate place to put proceeds from lowering your oil exposure.
We wondered & we heard. Watch BofA’s Paul Ciana make a technical case for oil to take a breather. He also pointed out a “bull flag pattern” in copper if Copper makes a weekly close above $440. And a close above 480-500 would signal a long term breakout, in his opinion.
But what about Oil? Ciana said:
- “we see a serious momentum wane in the secular uptrend in oil; last three higher highs have been reached with lower momentum; … RSI has made lower highs while prices have made higher highs …. time to take a breather “
How far could oil fall? Ciana answered 15% & even head to the 50-week moving average.
4. “100% contrarian to everyone’s views“
We re-heard Ivy Zelman, the smart housing analyst, on CNBC this Friday. While that interview was fine, it reminded us of a hard-hitting Zelman interview a couple of weeks ago:
- ” … we have just recently published .. a report called Cradle to Grave that is 100% contrarian to everybody’s views that the United States has a severe deficit [of housing] .. we actually believe that the industry is already overbuilding … single-family to normalized demand [is overbuilt] by roughly 20% and about 10% for multi-family … “
We do remember how housing peaked before the economy in the 2006-2008 cycle & how the final gusto was in oil before the economy pointed downwards. 2021-2022 is nowhere near the scale of 2007-2008 but the similarities are getting interesting. Bernanke did come into 2007 talking hawkish just like Powell is beginning to. And chances of new real money coming into pockets of American families are rapidly dwindling with the mess in Washington DC and consumer confidence is going downhill.
Watch Cramer tell Ms. Zelman that “I am not going to go against you; I have lost too much money any time I have … “. For our part, we sincerely hope Ms. Zelman is wrong, very wrong. Because the economy cannot lose the stimulus it has been getting from the housing market.
Send your feedback to editor.macroviewpoints@gmail.com Or @MacroViewpoints on Twitter