Summary – A top-down review of interesting calls and comments made last week in Treasuries, monetary policy, economics, stocks, bonds & commodities. TAC is our acronym for Tweets, Articles, & Clips – our basic inputs for this article.
Editor’s Note: In this series of articles, we include important or interesting Tweets, Articles, Video Clips with our comments. This is an article that expresses our personal opinions about comments made on Television, Tweeter, and in Print. It is NOT intended to provide any investment advice of any type whatsoever. No one should base any investing decisions or conclusions based on anything written in or inferred from this article. Macro Viewpoints & its affiliates expressly disclaim all liability in respect to actions taken based on any or all of the information in this article. Investing is a serious matter and all investment decisions should only be taken after a detailed discussion with your investment advisor and should be subject to your objectives, suitability requirements and risk tolerance.
1.Stability returns? Return to 60-40?
Last week we wrote about instability in the Treasury market & the resultant refusal of foreigners to come in to buy Treasuries. The Treasury market mockingly said stability/shemibility and rallied hard this week:
- 30-yr Treasury yield down 12 bps on the week; 20-yr yield down 11 bps; 10-yr down 19 bps; 7-yr down 19 bps; 5-yr down 17 bps; 2-yr down 13 bps & 1-yr down 4 bps. TLT & EDV up 2.5% on the week.
What happened? As Hartnett of BAML reported, Treasuries got the largest inflows since March 2020 ($11.5 billion) last week.
And the largest fall in long Treasury yields came on Wednesday AFTER the horrible PPI numbers. Not all that surprising if you buy the historical fact that declines begin right after a peak.
But that logic, perhaps spurious to many, would be valid only if the Fed has tightened financial conditions to the point of squeezing out at least some hot air. This would be laughable to those who point out Powell wants to be the 2nd Volcker. But has Powell already done a Volckerian job?
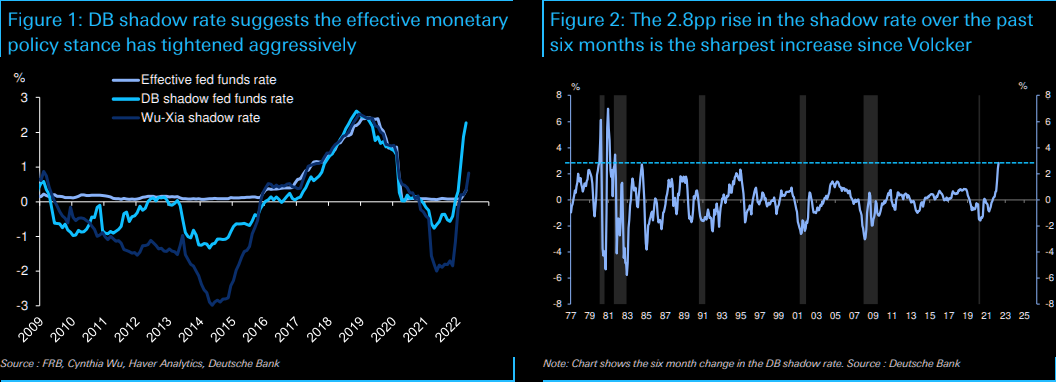
- DB via The Market Ear – Powell has already done a Volcker – The great macro team at DB on their shadow rate and Powell’s actions”…our shadow fed funds rate currently stands near 2.3%, which is 2.8 percentage points higher than its level six months ago. This nearly three percentage point rise in our shadow rate over the past half year, which reflects not only the Fed’s tightening moves but also their balance sheet decisions and guidance about future policy, is the sharpest rise in this metric since the Volcker Fed in 1981“. The investment bank basically argues that Fed has already gone a long way in positioning policy to the economic outlook. US financial conditions have tightened substantially in recent weeks…(not due to the 75 bps hikes only).
And look while TLT & EDV were up 2.5%, high yield ETFs HYG & JNK were down 1.2% on the week. And leveraged closed-end credit funds DPG UTG were down 2%+. Double And this was the 1st week since Brainard’s Rapid QT war cry on April 5 to show HYG/JNK underperforming TLT.
But if the Fed has already chocked off some of the hot air, then we should see some fade, right?
- David Rosenberg@EconguyRosie – – I was wondering why the stock and bond markets were taking the CPI data in stride, until I saw that ex-new cars, food and airlines, the other 82% of the index actually saw prices virtually flatten on the month. Fade the “broadening out” story. #RosenbergResearch
Rosenberg turned full-bore Un-Rosy on BNN Bloomberg on Thursday in saying ” … U.S. going to recession is as close to inevitable as anything … “. He is not alone. This week we also heard Larry McDonald utter the R-word:
Notice something else this week? Stocks were down hard from Monday to mid afternoon Thursday AND Treasuries were simultaneously up hard from Monday to mid afternoon Thursday. Then Stocks began rallying and Treasuries began simultaneously falling in price. This accelerated on Friday with stocks (esp. NDX) rallying hard and Treasuries falling hard in price.
And for the whole week, S&P & NDX were down 2.4% while TLT was up 2.5%. Isn’t that exactly what the old celebrated 60-40 allocation wisdom preaches? Is that discarded allocation approach coming back?
But for that to happen, shouldn’t commodities lose some of their hot air of assured up moves? Look while everyone is focused on the intense fall in MAFAA, few are talking about the 35% fall in darlings like CLF & FCX.
Of course for all this to work the Treasury market has to remain at least benign. If it actually rallies then the best investment going forward would be in the 20-30 year Treasuries, TLT or their juiced up cousins 20-30 yr Zero-coupon Treasuries, or EDV & ZROZ.
2. Stocks bounce for short or intermediate term?
For the second consecutive week VIX fell while stocks fell. This week VIX fell by 4.4% while Dow, S&P, NDX & RUT all fell 2-3%. The week before VIX fell 9.6% while Dow, S&P & NDX were almost unchanged.
What’s going on? VIX is a measure & tool for hedging positions against a steep decline. So when does VIX become less & less necessary? When there are less & less long positions that need hedging? At least that is what simple minds would think. But in this case smart hedge funds think the same, it would appear:
- The Market Ear – Hedge fund havoc: largest 5-day gross reduction ever – “Fundamental L/S Gross leverage saw the largest 5-day reduction on our record, driven by mark-to-market as long losses have far outweighed gains from short positions” (GS Prime Brokerage)
In this scenario,
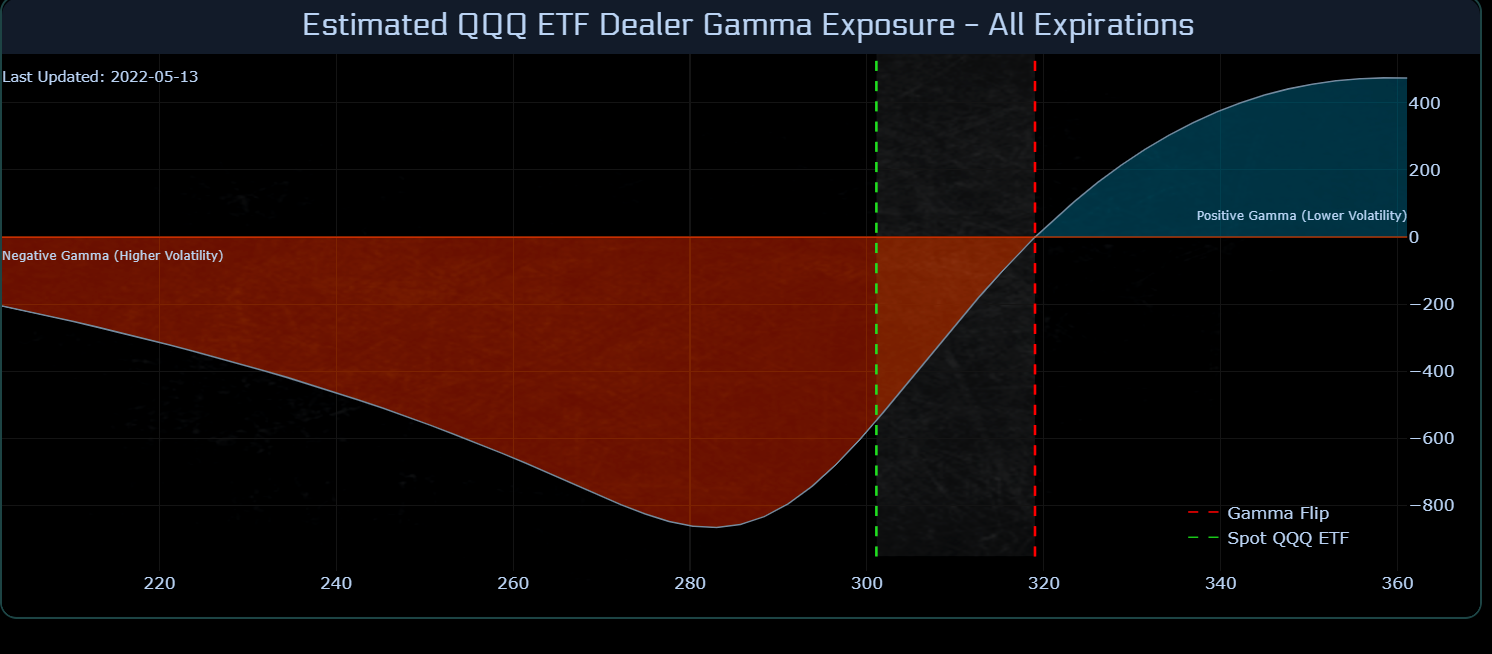
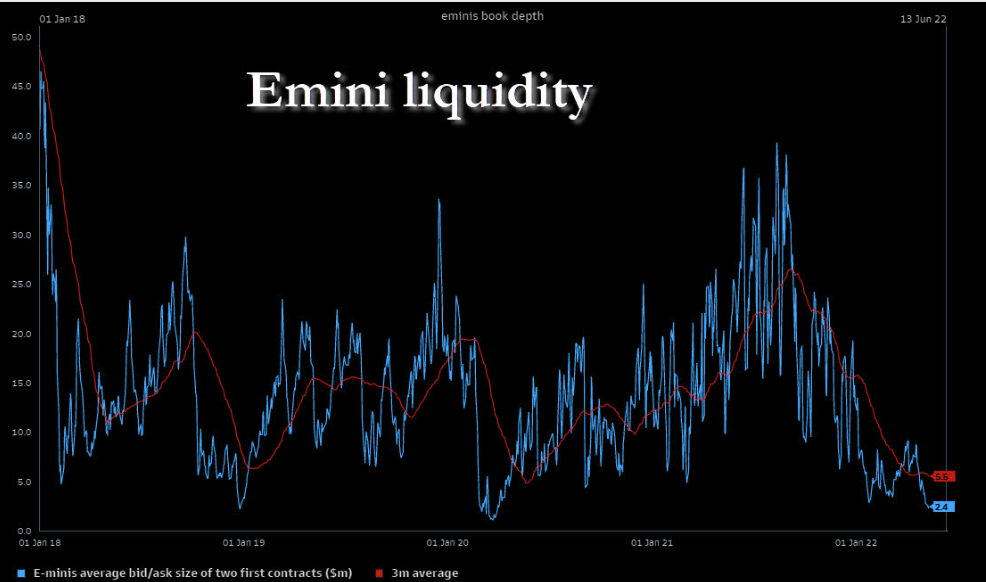
- The Market Ear – Erratic is king – The main pillars of this market stay intact: short gamma and poor liquidity. We are moving away from the “deepest” short gamma levels, but QQQ’s remain in short gamma land. The agony of selling lows and chasing highs continues…all in a poor liquidity volume environment.
Is this why we saw a 500-point rally in the last hour on Thursday to wipe out a torrid decline? Is this why we saw a ripping rally on Friday?
The old adage teaches that 90% down days don’t hold much meaning until they are followed by a 90% up day. That was why the correctly bearish Jonathan Krinsky called for a bounce late Friday morning:
- “bounce is overdue … saw first 90% in advancing volume day since June 2020 …. reasonable to expect a move to 4,200 – a 5% bounce … from bottom to high it would be a move in line with what we saw from January lows .. 4200 was a huge violation on the way down; its going to act as resistance on the way up;”
But just a bounce, said he on CNBC Half Time:
- ” … do we think the low yesterday was the low for the year or the low for this move? probably not … we saw 9% rally after the lows in January; 12% of the lows in March; none of those let to a bottom, right? but we are certainly at a point ; we are well overdue for that 8%, 9%, 12% relief rally; … “
A couple of hours later on CNBC Closing Bell, Katie Stockton was also clear about the difference between short term bounce and an intermediate term bottom:
- ” …. oversold rally we welcome that .. it is more significant than the last one that we saw meaning it should last a couple of weeks by our measures … our indicators are flashing short term oversold buy signals finally … we should see some outperformance by high beta with that shift in sentiment which is extremely bearish at this point”
- “yet we are not calling this an intermediate term low ; & that’s because we just don’t have those kinds of oversold buy signals on the weekly charts & certainly not on the monthly charts meaning the intermediate & long term posture of the market is still very tenuous … rather than buy into this bounce today we would recommend reduce exposure & keep to that tight stop loss discipline to manage risk … “
Tom McClellan seems willing to consider the possibility that is a meaningful bottom in his article Investors Intelligence Data at Bearish Extreme. He called the Investors Intelligence reading of 40.8% as a “pretty rarified territory only seen 3 other times in the past decade“. But he warned:
- “It has been bigger than this before. At the scariest point of the 2008 decline, the week of Oct. 3, 2008, it got all the way up to 53%. And in December 1994 it got all the way up to 59%. So it is possible to get this group to a greater bearish state than this, but it has been a long time since they have done that.”
Then he points out that
- “A similarly extreme sentiment reading comes from the NAAIM Exposure Index, which this week got down to 24. The NAAIM Exposure Index went a little bit lower than this at the bottom of the Covid Crash in March 2020. Other than that, we have to reach all the way back to the twin price bottoms in September 2015 and February 2016, when investors got fearful in the illiquid period following the end of QE3.”
So,
- “the current sentiment condition in these indicators is in the same range as what was seen at some really meaningful price bottoms. A sentiment reading is a condition, and not a “signal”, and the one thing such a reading will not tell you is when it is going to finally matter.”
Recall last week’s call by Eric Johnston about a 7-10% trading rally till May-end. He was very specific in pointing out that the Fed talk & economic news would be muted after this week for about two weeks until May end. Then we get Non Farm payrolls, inflation data and the FOMC meeting on June 15. Those are the events that can cause turmoil in both Treasury & Stock markets. So Johnston, Krinsky & Stockton may all prove right and any rally we see next week may only be a short affair.
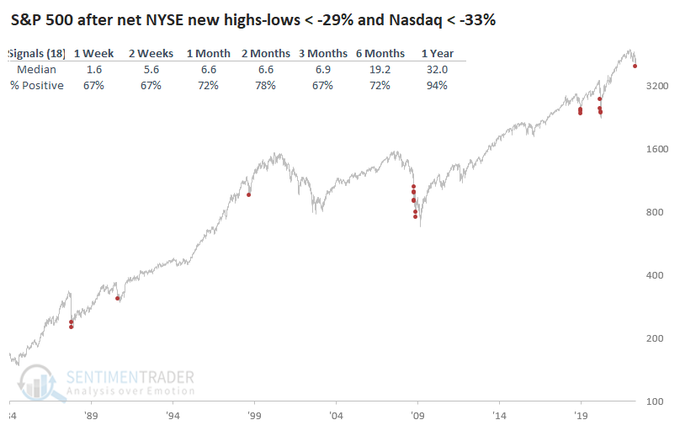
Looking backward a year from now what might you see statistically speaking?
3. Oil & Food
Yet another week in which the U.S. Dollar rallied hard, up 94 bps on the week. Is there anything worse for the global economy? The only other currency that investors used to consider holding is now perilously close to par with the Dollar, a prospect no one even considered during the European crisis of 2011-2013.
- A🅻🅴🆂🆂🅸O@AlessioUrban – Dollar’s Strength Pushes World Economy Deeper Into Slowdown Most important thing is that a strong dollar won’t allow US to export inflation but only to import disinflation.. not helpful as wages are at the highest level on record
And China re-opens Shanghai on Monday:
- Javier Blas@JavierBlas – – OIL MARKET: Shanghai, which has been under lockdown for about 6 weeks, will start to reopen on Monday. If the re-opening actually do happen, the extra oil demand will come at the worst possible time as Russian crude supply drops | #OOTT
Wait a minute. Russia must be desperate to sell its oil, right? With EU ready to ban oil imports from Russia and steadfastly refusing to pay Rubles demanded by Putin?
- Bloomberg Politics@bpolitics – – The European Union is set to offer its gas importers a solution to avoid a breach of sanctions when buying fuel from Russia and still effectively satisfy President Vladimir Putin’s demand for payment in rubles “https://www.bloomberg.com/news/articles/2022-05-14/eu-drafts-plan-for-buying-russian-gas-without-breaking-sanctions?”
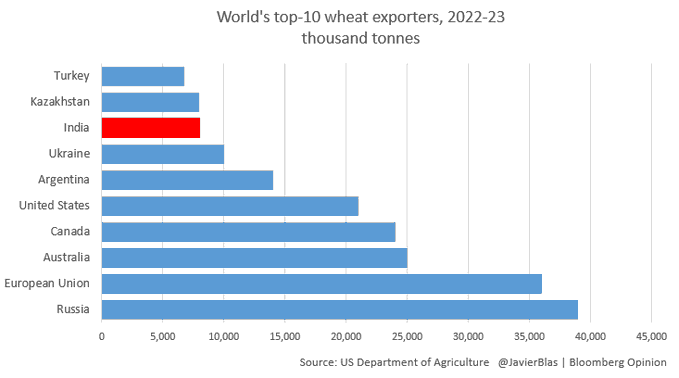
What happened to India’s promise to help the world, at least its own neighborhood, with its wheat reserves? Remember how India was so ready & willing to export its Covid vaccines before going into a domestic delta-variant crisis? Was that memory revived or did the food riots in next door Sri Lanka sent chills down the leadership in India? Stating food security is their goal, India suddenly announced a ban on wheat exports this week.
- Javier Blas@JavierBlas – – Before the export ban, India was expected to be one of the top-10 wheat exporters for the 2022-23 crop season. Removing all (or part of) India’s expected wheat exports creates a massive hole in the global supply and demand. Wheat prices will rise further, and quickly #OATT
The Indian Rupee fell to its all-time low this week and the Indian ETFs fell 4%-5% on the week, far worse than China, Brazil & Korea & EEM. While it sounds awful, it is letting India correct its over-valuation in currency:
- Charlie Bilello@charliebilello – – Currency Returns vs. US Dollar over the last year… Turkish Lira: -45% Argentine Peso: -20% Japanese Yen: -16% Polish Zloty: -15% Euro: -13% British Pound: -13% Australian Dollar: -10% Swiss Franc: -8% Canadian Dollar: -7% Indian Rupee: -5% Chinese Yuan: -4% Russian Ruble: +11%
Regarding Indian stock market, below is an example why we look forward to a real correction in Indian stocks, at least in some of the secular growth stocks we like (for example, ICICI Bank relative to JPMorgan on YTD, 3-yr & since turn of the last century):
Finally Gold fell 4% this week with GDX, GDXJ & NEM all falling 10% on the week.
C’est la vie or C’est la Powell?
Send your feedback to editor.macroviewpoints@gmail.com Or @Macroviewpoints on Twitter