Summary – A top-down review of interesting calls and comments made last week in Treasuries, monetary policy, economics, stocks, bonds & commodities. TAC is our acronym for Tweets, Articles, & Clips – our basic inputs for this article.
Editor’s Note: In this series of articles, we include important or interesting Tweets, Articles, Video Clips with our comments. This is an article that expresses our personal opinions about comments made on Television, Tweeter, and in Print. It is NOT intended to provide any investment advice of any type whatsoever. No one should base any investing decisions or conclusions based on anything written in or inferred from this article. Macro Viewpoints & its affiliates expressly disclaim all liability in respect to actions taken based on any or all of the information in this article. Investing is a serious matter and all investment decisions should only be taken after a detailed discussion with your investment advisor and should be subject to your objectives, suitability requirements and risk tolerance.
1.Streak over! Is the Trend over?
- Bespoke@bespokeinvest – It’s Over, Johnny.
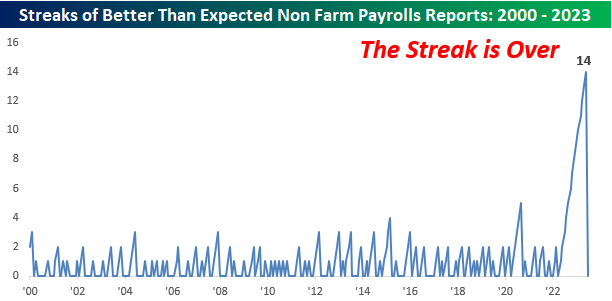
Friday’s Non-Farm Payroll report under-delivered after a long streak of going over. Some view the miss in more stark terms:
- David Rosenberg@EconguyRosie – When you take into account (i) back revisions, (ii) multiple-job holders and (iii) the Birth-Death model, nonfarm payrolls actually contracted in June. The recession has not been averted or avoided. The Fed will figure it out at some point but it will be too late.
The big question is whether this a definitive turn or is this a one-time miss? Wasn’t the ADP report created to minimize the confusion of the NFP report?
- Bespoke@bespokeinvest – Thu– The ADP payroll number has been exceeding forecasts by increasingly large margins lately.
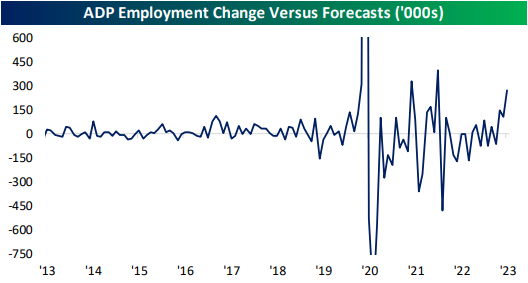
And this time the ADP number came in at a stunning 497,000 vs. the forecast of 248,000. Do we need competitors of ADP to come forth with their own private numbers?
- The Treasury market gave more credence to the ADP beat, it seems! The 3-yr yield was up 7.6 bps on Thursday’s ADP and fell 5.1 bps on Friday’s NFP; the 5-yr yield shot up 11 bps on ADP & fell only 2.4 bps on NFP; the 7-yr rose 11 bps on ADP & remained unchanged on NFP.
- Weirdly, the long end of the Treasury curve rose on both days – 30-yr yield up 6.5 bps on ADP & up 4.1 bps on NFP; 10-yr up 9.6 bps on ADP & up 1.7 bps on NFP.
Thankfully, we don’t have to ask why at least not until we get the reactions of the Treasury curve to the inflation numbers coming up this week. If that doesn’t clear up the confusion, then we can always look ahead to Chairman Powell.
But one factor has remained true & it might actually be the more important one:
- Ryan Detrick, CMT@RyanDetrick – Real disposable personal income is up to 4.0% YoY, highest in two plus years. We keep hearing about inflation eating away at wages, but that might not be totally true. Note – for years before COVID this was b/t 2% and 4%. Yet another clue things are getting back to normal?
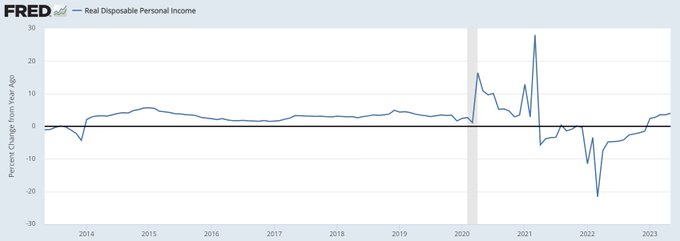
Is this strength in real disposable income driving the strength in the consuming-based economy? And won’t this increase in real disposable income keep its upward path as long as the Fed keeps raising interest rates & driving more income to money-market fund holders? If this is even remotely true, then isn’t the Fed itself creating this inflation in the consuming-based economy? What is this doing to the majority of Americans who still bank at regional banks & kinda stretch to meet the rising prices?
Fortunately it has been easier to guess the short-term direction of the stock market than figure out the above as we saw over the past two weeks.
2. Chartists & Traders
The call from @SPYSTSignals we featured last week paid off and was closed by the caller. Now the call is “my $VIX model is now bullish on vol again“.
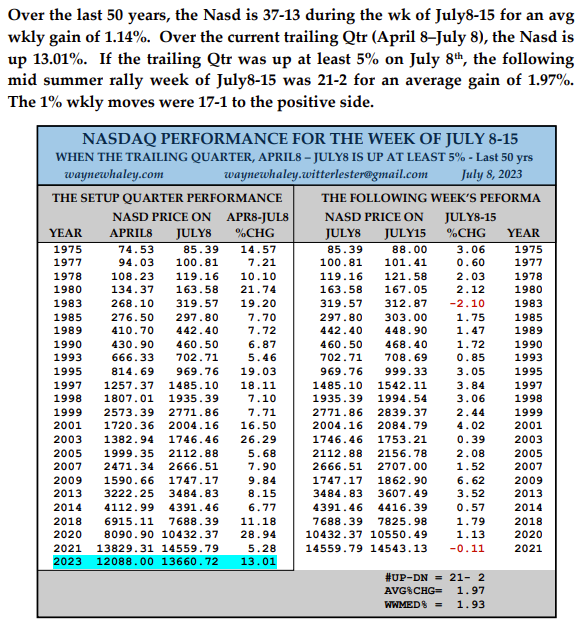
On the other hand Signor Wayne Whaley has reappeared with another trade idea – a 21-2 setup, one with which he himself is not fully on board:
- Wayne Whaley@WayneWhaley1136 – A 21-2 NASDAQ SETUP FOR THE WEEK OF JULY 8-15, COURTESY OF A +5% TRAILING QUARTER……. This study is a little more bullish than the author and I’ll claim messenger status on this one. Let’s see how it plays out.
Going back to the ADP & NFP reports, notice that the Dollar went down on both Thursday (down 25 bps) and Friday (down 84 bps). Does that make it a trade?
- Trader Z@angrybear168 – $UUP dollar entering a seasonally weak period into late July, price knocking on monthly VAL and right above daily 200 EMA, could see a break down next week.
Things are so weird that even the message from the Advance-Decline line seems two-sided. First the simple:
- Larry Tentarelli, Blue Chip Daily@LMT978 – July 6 – $SPX A/D Line – recent breakout to new all-time highs. Strong breadth. Base breakouts are bullish technical signals.
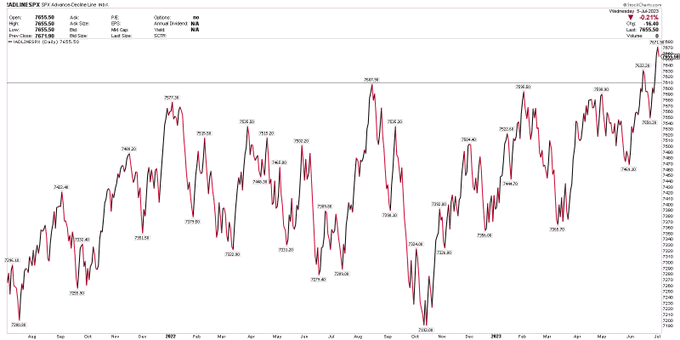
How weird is it that an article titled “SP500’s A-D Line at New High” is actually non-positive about the S&P 500 A-D line? Why? As Tom McClellan writes:
- “In the A-D statistics, every stock gets an equal vote, unlike the capitalization weighted indices which are dominated by the top handful of stocks. The stocks which make up the SP500 are the big winners, the varsity team of the stock market. They are not the stocks that are going to give us the first message about liquidity turning bad.”
So what A-D line does Mr. McClellan choose?
- “One of the best and most reliable A-D Lines is the one using A-D data for high yield corporate bonds.”
- “These issues drink from the same pool of liquidity as the stock market, and so when liquidity is strong they do great. When liquidity starts to dry up, they will often show that ahead of prices, which is the warning one hopes to get from using any A-D Line. Right now, the message is that the higher highs being made by the SP500 here happening without strong liquidity, in other words this is just coming from optimism and not from money. That is a problematic way to run an uptrend.”
With all this, is there any one willing to send a straight signal?
- Thomas Thornton@TommyThornton – Jul 7 – The $SPX may get the DeMark Sequential on day 12 of 13 on Monday and possibly sell Countdown 13 on Tuesday. The last sell Countdown 13 was on 12/13/22, also a CPI day.
3. Enough of the confusing double talk?
We have no clue why or wherefore, but Oil service stocks were a sight to behold on Friday. On the week, Oil was up 4.3%; Brent up 4.4%; OIH up 7.2%. Does this rally have legs?
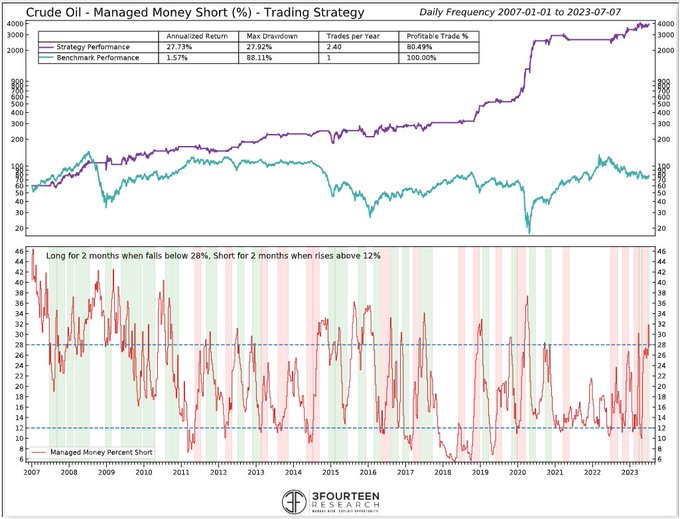
- Warren Pies@WarrenPies – CRUDE OIL – Last week’s rally triggered a powerful Managed Money buy signal for Crude. Hedge funds short positioning had reached levels last seen during the initial COVID craze. They are now unwinding.
He was not alone.
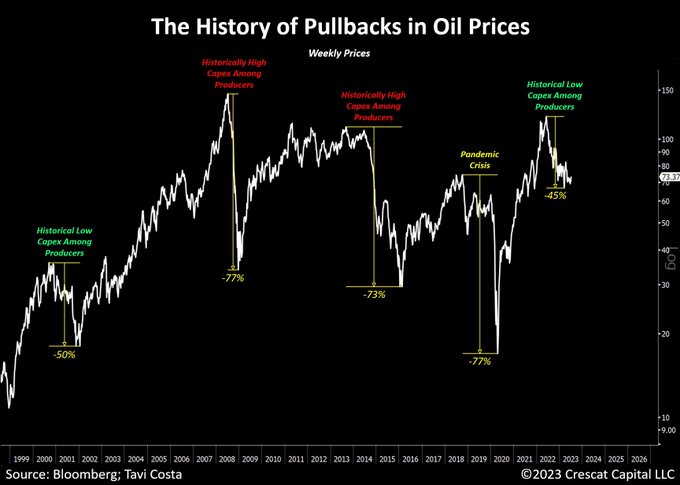
- Otavio (Tavi) Costa@TaviCosta – After being down 45% from its recent highs, the risk/reward to buy oil today appears heavily skewed towards the upside. Excluding the outlier event of the pandemic crisis, we can observe two types of pullbacks in oil prices over the past few decades: ▪️The GFC and the 2014… Show more
In his lengthy Real Vision presentation, Mr. Costa included XOP, the oil & gas ETF, as one of his top three ideas, the other two being EWZ & GLD.
Oil may be down but it has not been discarded yet. This week two smart guys identified a long trade in something that has been virtually discarded – Reits. On Thursday, Jonathan Krinsky said Buy Reits to Michael Santoli on CNBC. Among his reasons was that Reits could also act as a defensive sector. Listen to him yourselves:
Then came Carter Worth of & on CNBC Fast Money on Friday with his charts & his message about being so bad that it is good:
The chartmaster @CarterBWorth dives into why $IYR is the chart of the week!@karenfinerman agrees it's the time to buy. pic.twitter.com/V0MCYcuokI
— CNBC's Fast Money (@CNBCFastMoney) July 7, 2023
Send your feedback to editor.macroviewpoints@gmail.com Or @MacroViewpoints on Twitter