Summary – A top-down review of interesting calls and comments made last week in Treasuries, monetary policy, economics, stocks, bonds & commodities. TAC is our acronym for Tweets, Articles, & Clips – our basic inputs for this article.
Editor’s Note: In this series of articles, we include important or interesting Tweets, Articles, Video Clips with our comments. This is an article that expresses our personal opinions about comments made on Television, Tweeter, and in Print. It is NOT intended to provide any investment advice of any type whatsoever. No one should base any investing decisions or conclusions based on anything written in or inferred from this article. Macro Viewpoints & its affiliates expressly disclaim all liability in respect to actions taken based on any or all of the information in this article. Investing is a serious matter and all investment decisions should only be taken after a detailed discussion with your investment advisor and should be subject to your objectives, suitability requirements and risk tolerance.
1.2016 election, 10-million delta, rocket ship or 2020 election?
What about the 2016 election, you ask?
- ian bremmer@ianbremmer – Today is like the 2016 election but for US labor data forecasters.
- ian bremmer@ianbremmer – For people that spend their careers trying to understand the state of US economy, today’s job numbers are a historic miss. Vastly stronger than everyone expected.
How historic?
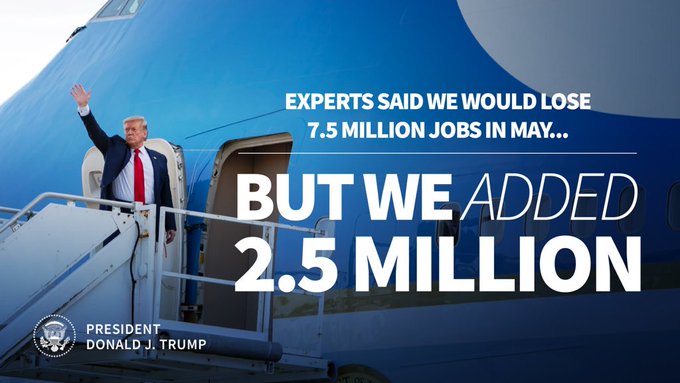
- jeroenblokland@jsblokland – These are truly amazing times! Instead of another 7.5 million jobs lost, the US economy added 2.5 million jobs in May, a ‘delta’ of 10 million jobs.
Forget 10 million & delta. The 2.5 million is the new omega.
- ian bremmer@ianbremmer – Hard to argue with this logic.#huge #biglyjobs
What logic?
- Donald J. Trump@realDonaldTrump – Greatest Top Five Monthly Jobs Gains in HISTORY. We are #1!
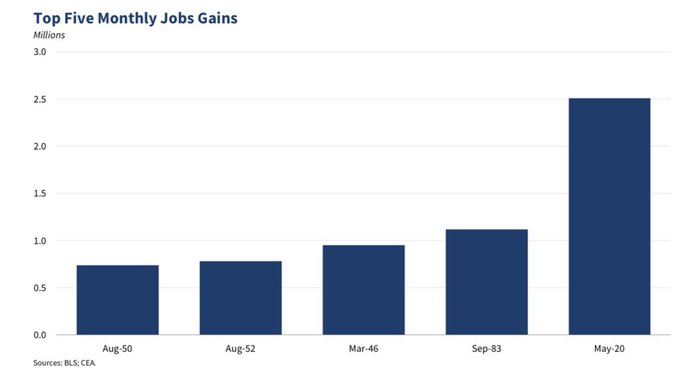
Look at that bar & you may also repeat:
- Sara Eisen@SaraEisen – “It is better than a V. It’s a rocket ship” @realDonaldTrump on the shape of the recovery
Almost right away, came this,
If that doesn’t get through to people,
- Mark R. Levin@marklevinshow – A vote for Trump is a vote for jobs. A vote for Biden is a vote for mobs.
This is not a political segment. It is purely a market segment in that ratcheting fears of a Biden win will be, in our opinion, an obstacle for the stock market in the summer. This jobs report might stop such fears from ratcheting.
Not merely that. The Senate GOP is now likely to mobilize behind President Trump because they follow strength & because they know if he loses in November, they will lose the Senate. So they will fall in behind the Payroll Tax Cut that President Trump wants & the House Democrats will not get too much in their way because they also have to face the voters. So get ready for another stimulus bill, this time with a Payroll Tax Cut and the promise of a big infrastructure program in 2021. Don’t you think that will be bullish for the fall?
2. 1998-1999 & a Completely New Situation
Our core thesis since March has been that the Fed will make the “too much” mistake this year instead of the “too little” mistake they made in 2007. Do you remember the last time the Fed made such a determined decision to err on the “too much” side? It was in November 1998. That Fed & the entire street was in panic about the Long Term Capital mess taking the street down. So the Fed poured & poured.
And what that economy like? Think back to July 1998 & you will recall that it was a strong economy. The damage to markets came from the huge money losing positions of the Nobel-littered Long Term Capital. That is why the pouring of more liquidity than needed in an economy that was fundamentally strong let loose animal spirits. And we got 1999.
How was the economy in February 2020? More job openings that people available to fill them. And then came the Pandemic. No one had seen anything like it. So the Fed went to war against it. They poured ahead of the spreading damage & poured the way no one had seen before. And they are still pouring it even at $7.16 trillion in the Fed’s Balance Sheet.
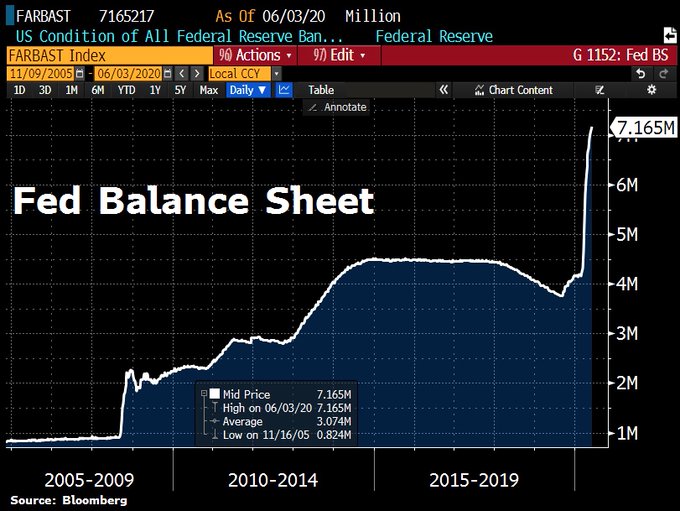
And they are pouring into an economy that was fundamentally strong before it was deliberately shut down. So by summer with New York, New Jersey & California reopening, Q3 economic numbers could actually stun on the upside. But the pouring by the Fed will continue to ward off against a Q4 relapse of the pandemic & the economy.
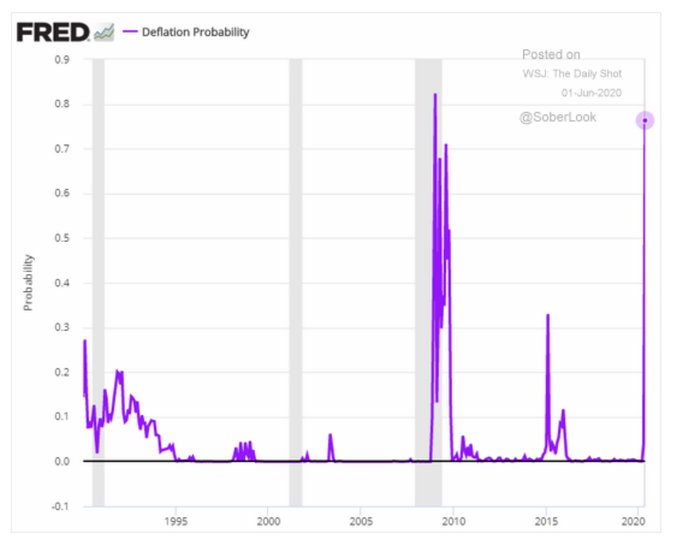
Not just that, but also because of the perennially scary specter is still in their face:
- Adam Tooze@adam_tooze – – The Fed’s deflation probability indicator has spiked to dangerous levels. FRED via@SoberLook
Simple minds like us think simply. And we saw something different, something simple in this year’s scary fall in markets & economy that we had not seen before not in 2000, 2006 or in 1998. This year, 2020, is the ONLY year with a massive stock market fall that features a reelection of a sitting President. Remember how detached President Bush seemed in 2008. He was done with his presidency. President Clinton paid very little attention to the economy in 2000. His presidency was nearing its end. There was no election in 1998 and President Clinton was totally preoccupied with something else.
In stark contrast, 2020 is the year for re-election of President Trump & the election for keeping the Senate Republican. And we saw The Multi-Pronged Launch on March 13 that Rose Garden address. On Thursday, March 19, we noticed risk assets make a turn. Then on March 23, the Fed announced its massive action plan. It was so obvious that week that we were all seeing America’s Power Unleashed.
What is this? The biggest 50-day S&P rally since 1952. The NDX rally is actually steeper.
As of Friday, both the Dow & the Russell 2000 have broken over their 200-day moving averages. Getting back to the Nasdaq 100, is a top being created with this strength? No says Tom McClellan in his article Non-Divergences Are Better Than Divergences:
He writes:
- “This indicator gives great divergences at price tops that matter. … The absence of a divergence at an overbought reading tells you that the market is likely to NOT be at an important top, and that is the really useful information. Trending moves are where the big money is made, as opposed to timing the reversals. … In this case, though, the absence of a divergent top at an overbought condition for this indicator is a pretty reliable sign that there is an intact uptrend, and it is still underway. “
Being simple, we don’t care whether a rally is called a “bull market” or a “bear market rally” as long as we make money in it. The question is where this rally can take us? Look what Michael Hartnett of BAML said, courtesy of The Market Ear:
- Hartnett: “Extreme times, extreme moves: 3 greatest bear market rallies of all-time were 1929 (onset Great Recession), 1938 (prior to WW2), 1974 (prior to NYC bankruptcy); assuming a similar trajectory off Feb lows would suggest the SPX at 3300-3600 sometime between Aug & Jan’21. extreme times, extreme moves”
Two weeks ago, we featured a clip of Jim Cramer explaining the methodology of Caroline Boroden in our section titled Binary:
- “If the S&P breaks out above the 200-day moving average, then the first target would be 3,720. But if the S&P 500 is unable to break out above its 200-day, then 2,766 would be the first downside target.”
- “The picture for NDX, Nasdaq 100, looks better given that NDX has broken above its 50-day & 200-day moving averages. So it only has to remain above last week’s low of 8860. Then the first upside target would be 9,660.”
Well, S&P broke above its 200-day & has not looked back since going above 3,200 intra-day before closing at 3194. So 3,720 is still a distance away & that fits with Hartnett’s 3300-3600 target above.
But the NDX has clearly broken above Ms. Boroden’s first target of 9660. So what is her next target ? 10543 followed by 11569. Does she have a target after 3,720 for the S&P? Yes, 4.136. It was kinda cute to see Jim Cramer feel abashed in discussing these targets.
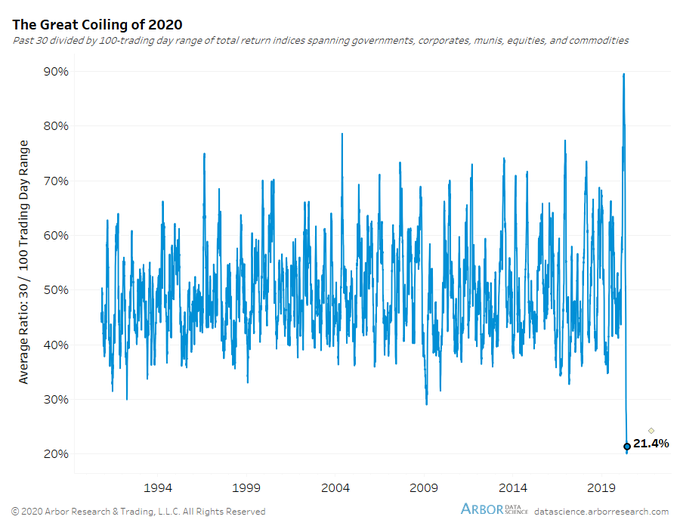
This is a weird time when data scientists (who presumably do not give in to animal spirits) start talking about tremendous break-out rally potential after we have seen the best 50-day rally since 1952:
- Ben Breitholtz@benbreitholtz – – As tensions rise everywhere, financial mkts have NEVER been so coiled (ie consolidated). The Fed’s arresting of vol has percolated into all asset classes. Either markets are set for a tremendous break-out or this will be one dull summer with prices still detached from headlines.
Any thought about which asset class looks ready to go whoopee?
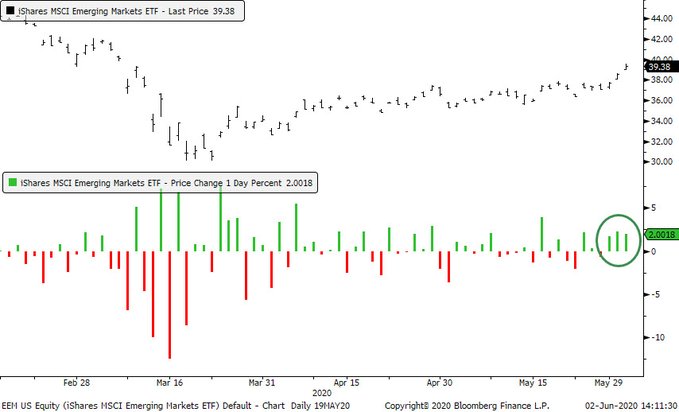
- SentimenTrader@sentimentrader – – The emerging markets fund $EEM has been up at least 1.7% for 3 straight days. It’s done this 5 times since inception. Two months later, it was higher all 5 times averaging a whopping 13.6%.
And one part of the EM space has already samba-ed to an extreme!
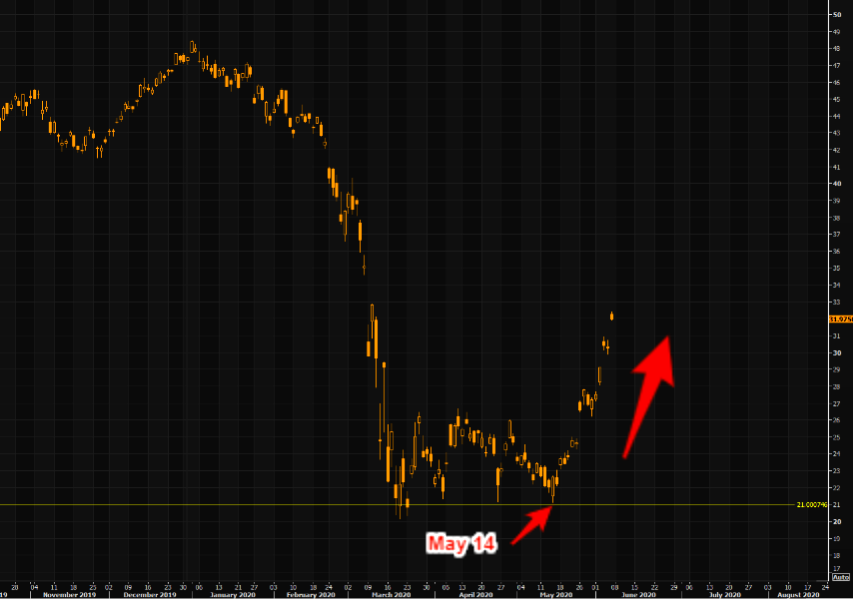
- Market Ear – Samba extreme – EWZ +52% in 16 sessions. Brazil Covid 19 stats are soaring as well as the BRL and EWZ. Our “Time for a contrarian Brazil long?” note on May 14 has out performed most trades (not that we thought this would happen in a few weeks). Impressive price action given the soaring Corona cases, but chasing it here looks rather late…
In the weirdest correlation of all, this huge rally in Brazil is happening simultaneously with a not-so-positive huge rally in Brazil virus cases:
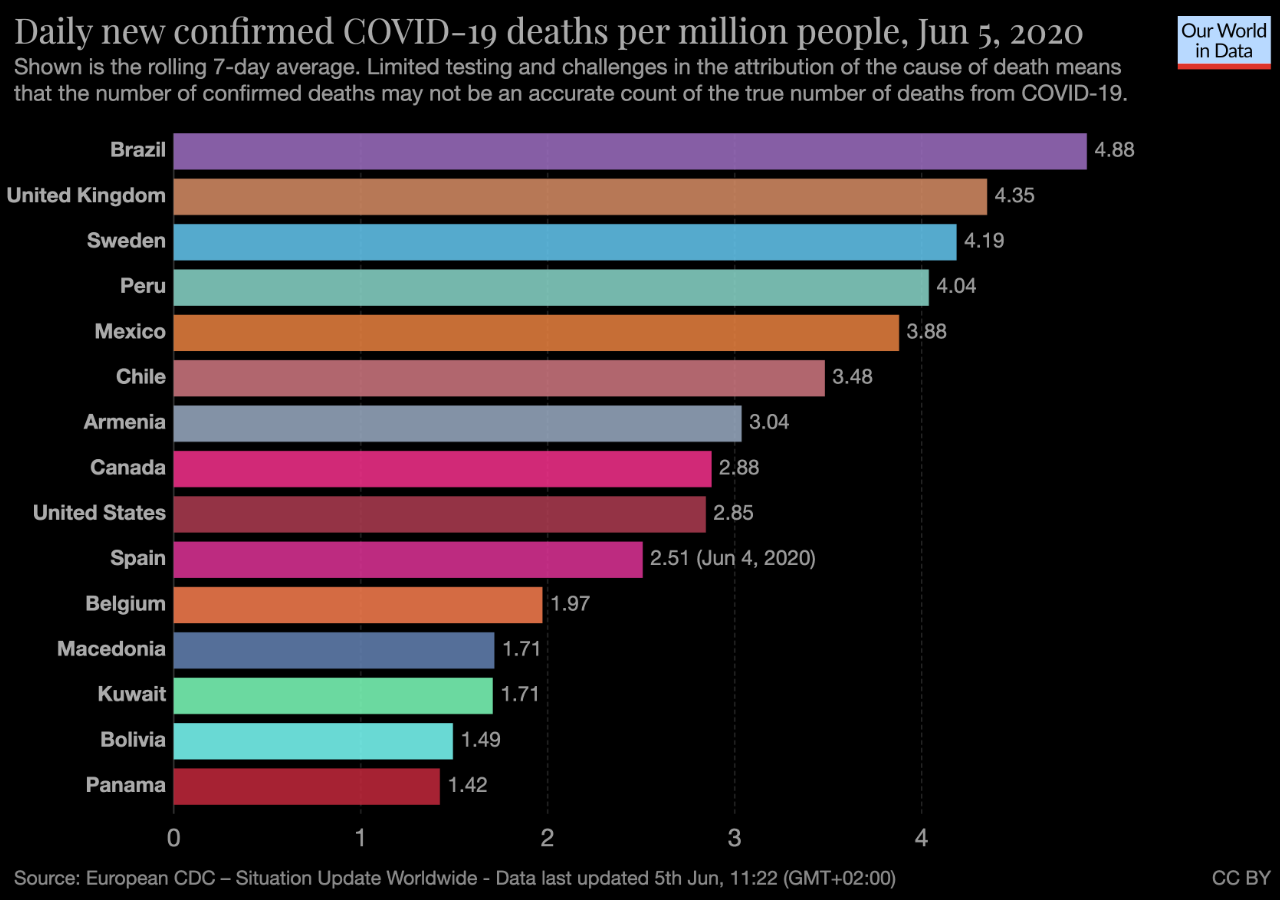
Go figure!
And don’t forget about the old world. The ECB delivered a Euro 600 billion increase in their PEPP stimulus program. No wonder, EWG, Germany ETF, rallied 9.9% this week.
3. Perfect, Perfecter & now Perfectest?
We began terming broad rally weeks in May as “perfect”. Then we had to go up to the “perfecter” term. Now what do we call this past week? Perfectest?
- Dow up 6.8%; S&P up 4.9%; Russell 2000 up 8.1%; Transports up 10.1%; EEM up 8%; EWZ (Brazil) up 15%; EWY (Korea) up 11.8%; Treasury ETFs, TLT & EDV down 4.8% & 5.9%; High Yield HYG & JNK up 2.5% & leveraged credit fund DPG up 9%; Dollar down 1.3%; Oil up 1%; Brent up 19%; MOS up 17%;
In another sign of perfectness, Dow was up every single day of the week and TLT, the Treasury ETF, was down every single day. Treasury rates were up every single day & 30-year yield was up 24 bps; 20-yr yield up 26 bps; 10-yr yield up 23 bps; 7-year yield was up 20 bps.
The big question is whether we will see an “extreme move” in Treasury yields as we have seen in S&P or Brazil or other asset classes? Why would such a move occur? Below is Michael Hartnett via The Market Ear:
- “ … Treasury is the next extreme move to watch. Summer pain trade a ” disorderly rise in government bond yields; GT30 toward 2%, GT10 through 1%“.
What factors could drive that? Hartnett’s reasoning via The Market Ear:
- the start of recovery was always a weaker dollar, and it’s happening,
- Global fiscal frenzy is real & big: $10tn of announced fiscal stimulus in 2020 now greater than $8tn of monetary stimulus
- Macro to surge in Q3 as pandemic/lockdown ends
- US corporations have raised $2.4tn of funds YTD
- Fed fails to “deliver” YCC next week
We will see what Chairman Powell says on Wednesday.
4. Dollar & Commodities
Despite a small rally on Friday, the Dollar fell 1.3% this week. But Gold fell harder, down 3.4% & Silver was down 4.9%. Gold miner ETF, GDX, fell 5.5% on the week.
The star of the week was Oil & Energy stocks. WTI was up 12%; Brent was up 19%. But OIH, Oil Services ETF, was up 30% & the big cap XLE was up almost 15%. This was a bit too much for resident technician Carter Worth who said Short XOP to play the stop in the Oil rally:
Send your feedback to editor@macroviewpoints.com Or @MacroViewpoints on Twitter