Summary – A top-down review of interesting calls and comments made last week in Treasuries, monetary policy, economics, stocks, bonds & commodities. TAC is our acronym for Tweets, Articles, & Clips – our basic inputs for this article.
Editor’s Note: In this series of articles, we include important or interesting Tweets, Articles, Video Clips with our comments. This is an article that expresses our personal opinions about comments made on Television, Tweeter, and in Print. It is NOT intended to provide any investment advice of any type whatsoever. No one should base any investing decisions or conclusions based on anything written in or inferred from this article. Macro Viewpoints & its affiliates expressly disclaim all liability in respect to actions taken based on any or all of the information in this article. Investing is a serious matter and all investment decisions should only be taken after a detailed discussion with your investment advisor and should be subject to your objectives, suitability requirements and risk tolerance.
1.”perfect week“
- Bespoke@bespokeinvest – The S&P 500 is on pace to have a ‘perfect week’ and close at a 52-week high for the first time since August.
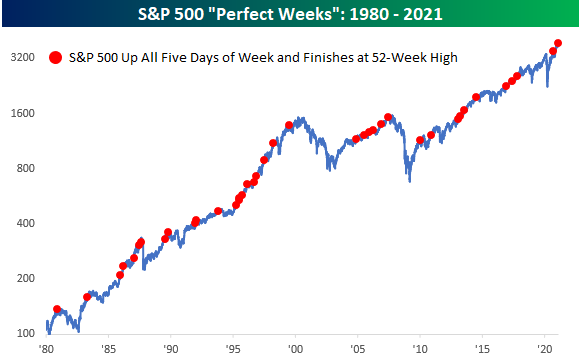
The S&P did close at a new all-time high and it was a perfect week indeed.
- Dow up 3.9%; S&P up 4.7%; Comp up 6%; NDX up 4.1%; RUT up 7.7%; EEM up 6%; Indian ETFs up 8%-9%; Oil up 9%; Freeport up 19%; US Banks up 8%-9%; Our favorite private Indian banks, HDB & IBN, up 14% & 16% resp.;
Last week we had written:
- “Such an extreme de-grossing should almost by definition lead to some level of re-grossing, right? On the other hand, it might take another stampede down to shake out everybody. Our own view is that this is not the big fall. It seems too much like a flash crash driven by one event. So at some point, we might bet a rally to recover the lost ground. If that rally doesn’t get to new highs, then we might get a bad February.”
What made it a flash crash? VIX fell 37% this week to 20.87. According to Lawrence McMillan of Option Strategist, the explosion in VIX from 21 to 37 last week “gave a new $VIX “spike peak” buy signal at the close of trading on January 28th, and it has since imploded all the way back down to 22.”
Now what if VIX keeps falling at gets to 15?
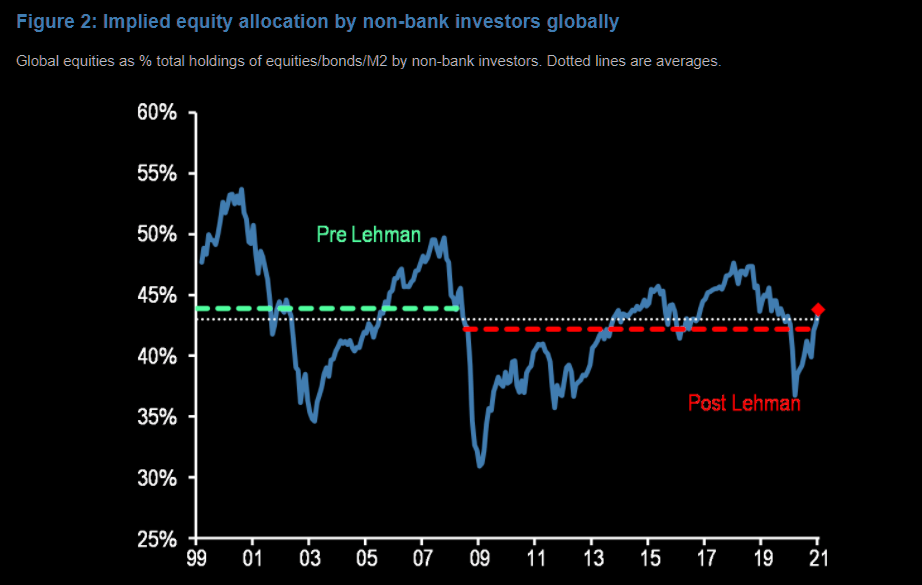
- JPM Cross-Asset via The Market Ear – The next 20% in equities – JPM Cross-Asset team is out with a strong defense for staying max long equities. “First, the de-risking that has already taken place by institutional investors provides the market with a cushion in the event that retail investors’ equity impulse slows from here. Second, we don’t believe that the equity bull market is yet exhausted. Two of our frameworks pointing to around 20% equity upside from here. The first framework is based on our most holistic metric of equity positioning based on global non-bank investors’ holdings of bonds, equities and cash. The argument is that the current implied equity allocation of 43.8% is still significantly below its post Lehman period high of 47.6% seen in January 2018 and that the equity appreciation needed to mechanically shift the implied equity allocation of non-bank investors globally from its current level to the post Lehman period high is 23% for the MSCI AC World index and even more for the S&P500. The second framework is based on our S&P500 fair value framework which also suggests just over 20% of upside in our baseline scenario where the S&P500 Equity Risk Premium (ERP) reverts to 4.5%, i.e. the low end of its post Lehman crisis period range”
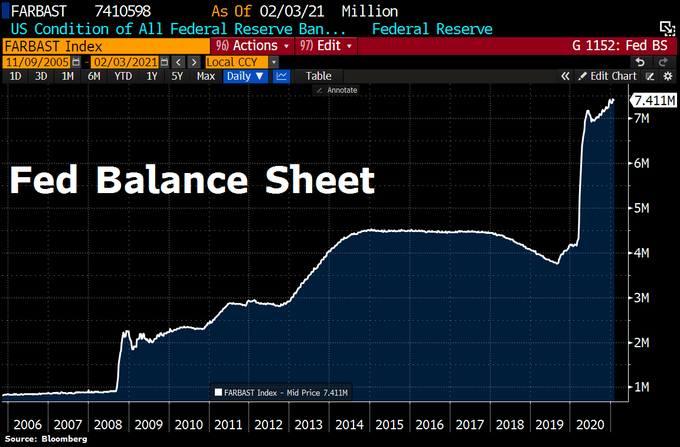
What about the Fed’s Balance Sheet, you ask?
- Holger Zschaepitz@Schuldensuehner – In case you missed it: #Fed balance sheet has hit fresh ATH at $7.41tn as US CenBank has added $5.97bn worth of treasury securities. Total assets now equal to 35% of US’s GDP vs #ECB‘s 70.5% and BoJ’s 132%.
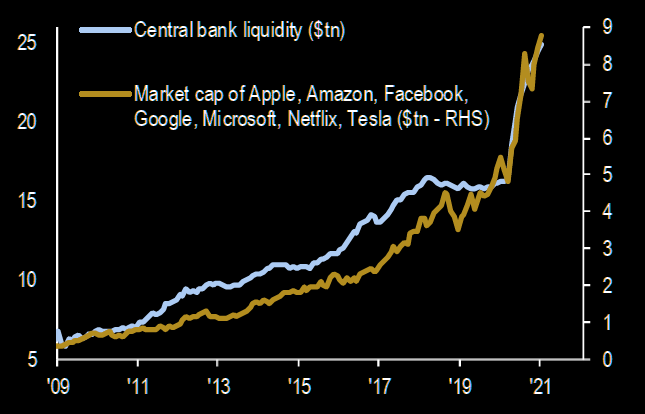
Remember our MC/FB indicator (Market Cap/Fed Balance sheet), especially for FAANG. What would happen if we replace the Fed’s Balance Sheet by Total Central Bank Liquidity:
- From BofAM via The Market Ear – Big FED and Big TECH – First FED and then all these blow-out earnings report too followed up by massive inflow (largest weekly inflow to tech ever). How great can it get?
Tom McClellan provides another way to measure the liquidity in the markets in his article Bond CEF A-D Line Confirming Higher Price Highs:
- “That is the message right now, that liquidity is plentiful enough to lift the broad market in a big way. The SP500 had a small swoon at the tail end of January 2021, but the Bond CEF A-D Line kept on chugging higher. It led the way in making higher highs ahead of the SP500 finally catching up. … the message is that liquidity is fine and the stock market ought to be able to continue moving higher. There may be ordinary stumbles and corrections along the way, but when liquidity is strong the market can better absorb those punches and continue moving higher.”
Looking back to what we had written two weeks ago about a rally?
- “Just imagine – 1) a fall in Treasury yields; 2) Fed committing to more monetary support; 3) great earnings; 4) megacaps-FAANG fully rested after a 2-month consolidation; 5) VIX falling further leading to 6) greater leveraging in from Vol Control Funds!!! What words did Tom Lee use for the rally he forecast – Explosive?”
By now we have everything in that list except for fall in Treasury yields. That does depend on which Dividend Discount Model you choose – one based on the 30-year yield or the one based on the 2-year yield (the one David Tepper used back in 2009 and during the Tepper corollary). Why? Just look where the 2-year Treasury yield has fallen to?
- Holger Zschaepitz@Schuldensuehner – US yields on course to negative? US 2y yields sink to fresh All-Time low of 0.1013%.
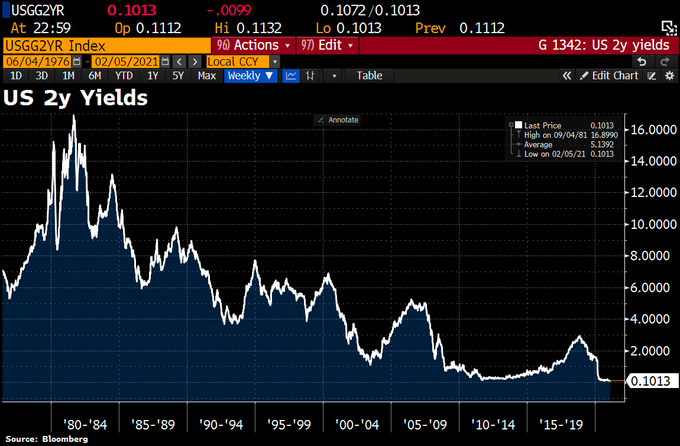
No one on CNBC noticed this highly suggestive chart. Don’t you need massive buying to get the 2-year yield to fall so much & so relentlessly?
2. Economy & Stimulus
The Non-Farm payroll report disappointed some by coming in weaker than expected:
- Bespoke@bespokeinvest – US Jan Nonfarm Payrolls +49k vs +105k exp/-140k prev 2m Net revisions -159k Avg hourly earnings +5.4% YoY vs +5.0% exp/+5.1% prev U3 UER 6.3% vs 6.7% exp/prev U6 UER 11.1% vs 11.7% prev LFPR 61.4% vs 61.5% exp/prev
But others saw through the apparent weakness:
- Richard Bernstein@RBAdvisors – Avg weekly hours (leading indicator because OT leads new hires) is now the highest in 20 years. #Future #employment looks increasingly #positive.
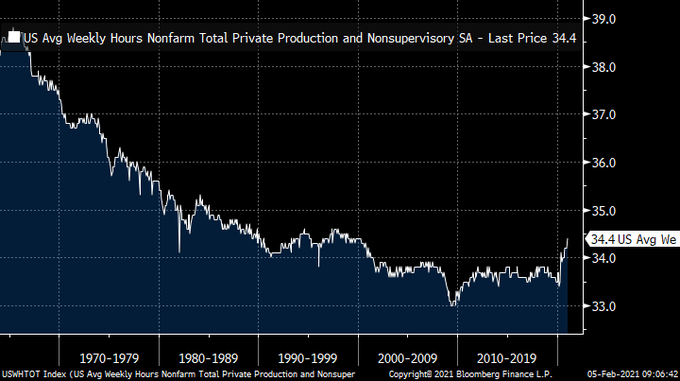
Rick Rieder of BlackRock also focused on the average work week number to predict that we will get to 4% unemployment by year-end. He also said that growth will surprise & give us a 7% Real GDP number this year. He doesn’t think that even a 1.5% 10-year yield will hurt the stock market because corporates are still able get financing at 30-60 bps from the bond markets. Combine that with 4% earnings yield and companies are getting real direct injection of value. Rieder likes techs, cyclicals, consumer durable & some Chinese techs.
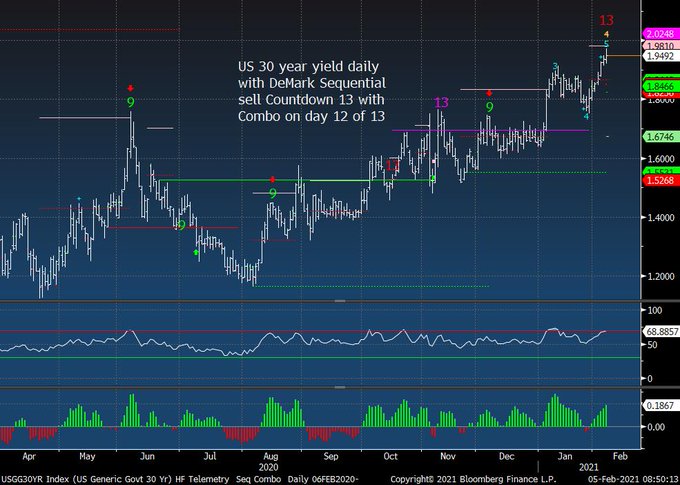
So what about long maturity Treasury yields? Carter Worth of CNBC Options Action said on Friday that yields should keep going higher to about 1.25% on the 10-year. On the other hand,
- Thomas Thornton@TommyThornton – US 30 year yield could be near short term top.
3. Just a prelude
All the above terrific stuff this week was just a prelude to an event that we will probably remember for ever. We still remember the Super Bowl between Terry Bradshaw’s Steelers & Roger Staubach’s Cowboys in 1979. Nineteen players between those two teams went to the Hall of Fame. This Sunday’s Super Bowl will be even better we hope. The AFC Championship two years ago between Brady & Mahomes was an absolute classic. This game, we think, will be better.
Send your feedback to editor@macroviewpoints.com Or @MacroViewpoints on Twitter